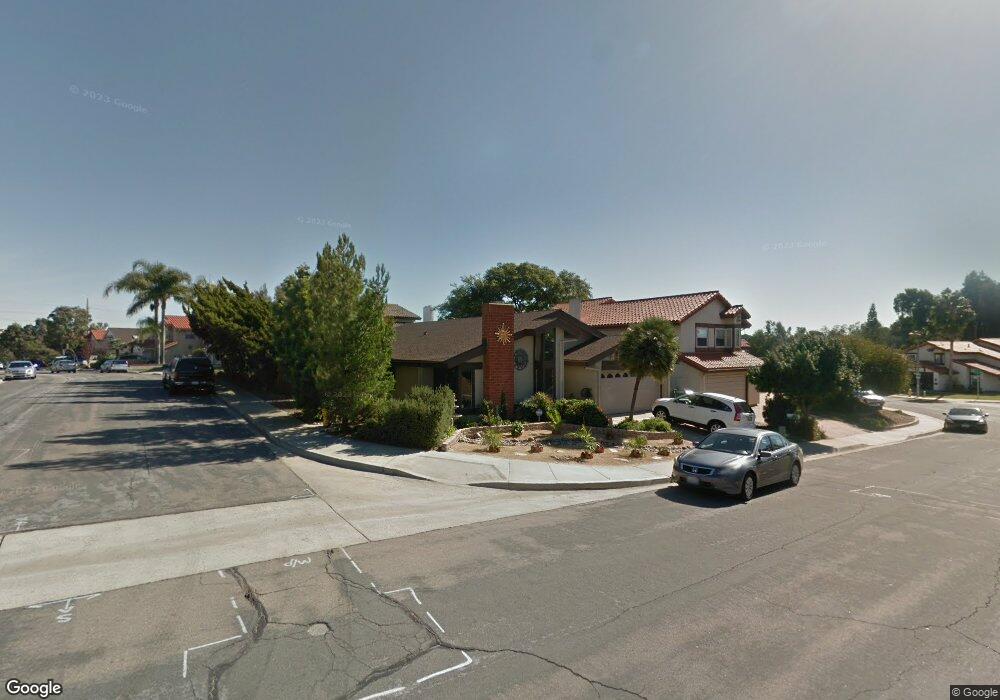
6069 Via Regla San Diego, CA 92122
University City NeighborhoodEstimated Value: $1,436,810 - $1,803,000
2
Beds
2
Baths
2,036
Sq Ft
$800/Sq Ft
Est. Value
About This Home
This home is located at 6069 Via Regla, San Diego, CA 92122 and is currently estimated at $1,629,453, approximately $800 per square foot. 6069 Via Regla is a home located in San Diego County with nearby schools including Marie Curie Elementary School, Standley Middle School, and University City High School.
Ownership History
Date
Name
Owned For
Owner Type
Purchase Details
Closed on
Feb 23, 2009
Sold by
Gallegos Nina M and Cooper Nina Mina
Bought by
Gallegos Antony G and Gallegos Nina M
Current Estimated Value
Home Financials for this Owner
Home Financials are based on the most recent Mortgage that was taken out on this home.
Original Mortgage
$379,000
Outstanding Balance
$238,168
Interest Rate
4.91%
Mortgage Type
Stand Alone Refi Refinance Of Original Loan
Estimated Equity
$1,391,285
Purchase Details
Closed on
May 26, 2006
Sold by
Cooper Nina
Bought by
Cooper Nina Mina
Home Financials for this Owner
Home Financials are based on the most recent Mortgage that was taken out on this home.
Original Mortgage
$360,000
Interest Rate
6.82%
Mortgage Type
Negative Amortization
Purchase Details
Closed on
Aug 22, 2005
Sold by
Cooper Scott
Bought by
Cooper Nina
Purchase Details
Closed on
Oct 8, 1992
Create a Home Valuation Report for This Property
The Home Valuation Report is an in-depth analysis detailing your home's value as well as a comparison with similar homes in the area
Home Values in the Area
Average Home Value in this Area
Purchase History
| Date | Buyer | Sale Price | Title Company |
|---|---|---|---|
| Gallegos Antony G | -- | Corinthian Title Company | |
| Cooper Nina Mina | -- | Commonwealth Land Title Co | |
| Cooper Nina | -- | -- | |
| -- | $285,000 | -- |
Source: Public Records
Mortgage History
| Date | Status | Borrower | Loan Amount |
|---|---|---|---|
| Open | Gallegos Antony G | $379,000 | |
| Closed | Cooper Nina Mina | $360,000 |
Source: Public Records
Tax History Compared to Growth
Tax History
| Year | Tax Paid | Tax Assessment Tax Assessment Total Assessment is a certain percentage of the fair market value that is determined by local assessors to be the total taxable value of land and additions on the property. | Land | Improvement |
|---|---|---|---|---|
| 2025 | $5,898 | $494,068 | $173,353 | $320,715 |
| 2024 | $5,898 | $484,381 | $169,954 | $314,427 |
| 2023 | $5,766 | $474,884 | $166,622 | $308,262 |
| 2022 | $5,611 | $465,573 | $163,355 | $302,218 |
| 2021 | $5,571 | $456,445 | $160,152 | $296,293 |
| 2020 | $5,503 | $451,765 | $158,510 | $293,255 |
| 2019 | $5,403 | $442,907 | $155,402 | $287,505 |
| 2018 | $5,051 | $434,223 | $152,355 | $281,868 |
| 2017 | $4,929 | $425,710 | $149,368 | $276,342 |
| 2016 | $4,848 | $417,364 | $146,440 | $270,924 |
| 2015 | $4,776 | $411,096 | $144,241 | $266,855 |
| 2014 | $4,700 | $403,044 | $141,416 | $261,628 |
Source: Public Records
Map
Nearby Homes
- 5448 Noah Way
- 5266 Diane Ave
- 4612 Benhurst Ave
- 5191 Millwood Rd
- 5889 Cozzens St
- 7212 Florey St
- 7056 Haworth St
- 4224 Governor Dr
- 5165 Winthrop St
- 5162 Limerick Ave
- 4635 Pauling Ave
- 6214 Agee St Unit 34
- 5284 Winthrop St
- 5192 Providence Rd
- 5402 Cole St
- 4972 Ensign St
- 5257 Cole St
- 5249 Cole St
- 6188 Agee St Unit 230
- 4627 Huggins St
- 6059 Via Regla
- 4925 Maynard St
- 4904 Via Cinta
- 6071 Via Regla
- 4935 Maynard St
- 4934 Via Cinta
- 4924 Maynard St
- 4954 Via Cinta
- 6075 Via Regla
- 6066 Via Regla
- 6070 Via Regla
- 4945 Maynard St
- 6074 Via Regla
- 6062 Via Regla
- 4974 Via Cinta
- 4934 Maynard St
- 6058 Via Regla
- 6054 Via Regla
- 6079 Via Regla
- 4955 Maynard St