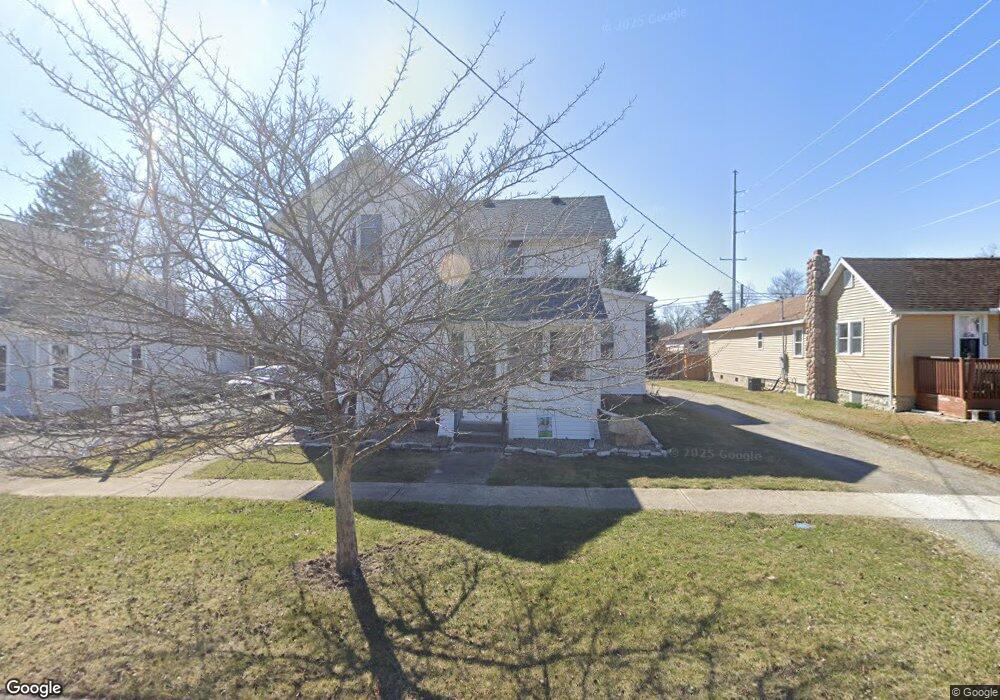
607 2nd St Findlay, OH 45840
Estimated Value: $156,000 - $180,000
4
Beds
2
Baths
1,975
Sq Ft
$85/Sq Ft
Est. Value
About This Home
This home is located at 607 2nd St, Findlay, OH 45840 and is currently estimated at $167,873, approximately $84 per square foot. 607 2nd St is a home located in Hancock County with nearby schools including Whittier Elementary School, Wilson Vance Elementary School, and Donnell Middle School.
Ownership History
Date
Name
Owned For
Owner Type
Purchase Details
Closed on
Aug 8, 2006
Sold by
Wells Fargo Bank Na
Bought by
Hall Devra
Current Estimated Value
Home Financials for this Owner
Home Financials are based on the most recent Mortgage that was taken out on this home.
Original Mortgage
$64,800
Outstanding Balance
$38,947
Interest Rate
6.78%
Mortgage Type
Purchase Money Mortgage
Estimated Equity
$128,926
Purchase Details
Closed on
Apr 26, 2006
Sold by
Melick Stephen L
Bought by
Wells Fargo Bank Na
Purchase Details
Closed on
Aug 25, 2000
Sold by
Harmon Derol G
Bought by
Young Tonya L and Melick Stephen L
Home Financials for this Owner
Home Financials are based on the most recent Mortgage that was taken out on this home.
Original Mortgage
$95,000
Interest Rate
8.12%
Mortgage Type
New Conventional
Purchase Details
Closed on
Jul 12, 2000
Sold by
Poe Robert S
Bought by
Harmon Derol G and Harmon Lisa S
Home Financials for this Owner
Home Financials are based on the most recent Mortgage that was taken out on this home.
Original Mortgage
$95,000
Interest Rate
8.12%
Mortgage Type
New Conventional
Create a Home Valuation Report for This Property
The Home Valuation Report is an in-depth analysis detailing your home's value as well as a comparison with similar homes in the area
Home Values in the Area
Average Home Value in this Area
Purchase History
| Date | Buyer | Sale Price | Title Company |
|---|---|---|---|
| Hall Devra | $72,000 | Service Link | |
| Wells Fargo Bank Na | $79,000 | Public Square Title Agency L | |
| Young Tonya L | $100,000 | -- | |
| Harmon Derol G | $80,000 | -- |
Source: Public Records
Mortgage History
| Date | Status | Borrower | Loan Amount |
|---|---|---|---|
| Open | Hall Devra | $64,800 | |
| Previous Owner | Young Tonya L | $95,000 | |
| Previous Owner | Harmon Derol G | $80,500 |
Source: Public Records
Tax History
| Year | Tax Paid | Tax Assessment Tax Assessment Total Assessment is a certain percentage of the fair market value that is determined by local assessors to be the total taxable value of land and additions on the property. | Land | Improvement |
|---|---|---|---|---|
| 2024 | $1,504 | $41,250 | $6,260 | $34,990 |
| 2023 | $1,506 | $41,250 | $6,260 | $34,990 |
| 2022 | $1,501 | $41,250 | $6,260 | $34,990 |
| 2021 | $1,234 | $29,540 | $6,260 | $23,280 |
| 2020 | $1,234 | $29,540 | $6,260 | $23,280 |
| 2019 | $1,209 | $29,540 | $6,260 | $23,280 |
| 2018 | $1,168 | $26,130 | $5,690 | $20,440 |
| 2017 | $1,167 | $26,130 | $5,690 | $20,440 |
| 2016 | $1,160 | $26,130 | $5,690 | $20,440 |
| 2015 | $1,005 | $22,340 | $5,690 | $16,650 |
| 2014 | $1,005 | $22,340 | $5,690 | $16,650 |
| 2012 | $1,279 | $28,170 | $5,690 | $22,480 |
Source: Public Records
Map
Nearby Homes
- 731 5th St
- 216 1st St
- 206 Greenlawn Ave
- 829 Maple Ave
- 123 Glendale Ave
- 865 S Main St
- 1100 Stall Dr
- 400 E Pearl St
- 1304 Douglas Pkwy
- 15591 Canadian Way
- 15586 Canadian Way
- 15615 Canadian Way
- 315 Fairlawn Place
- 623 E Sandusky St
- 324 W Mcpherson Ave
- 1037 Fishlock Ave
- 1113 Hurd Ave
- 423 Elm St
- 412 Lima Ave
- 1726 Eastview Dr
- 605 2nd St
- 611 2nd St
- 1114 S Blanchard St
- 523 2nd St
- 1118 S Blanchard St
- 519 2nd St
- 0 S Blanchard St
- 1126 S Blanchard St
- 1024 S Blanchard St
- 517 2nd St
- 1105 S Blanchard St
- 1101 S Blanchard St
- 1115 S Blanchard St
- 1130 S Blanchard St
- 1117 S Blanchard St
- 518 2nd St
- 515 2nd St
- 520 2nd St
- 1031 S Blanchard St
- 1121 S Blanchard St
Your Personal Tour Guide
Ask me questions while you tour the home.