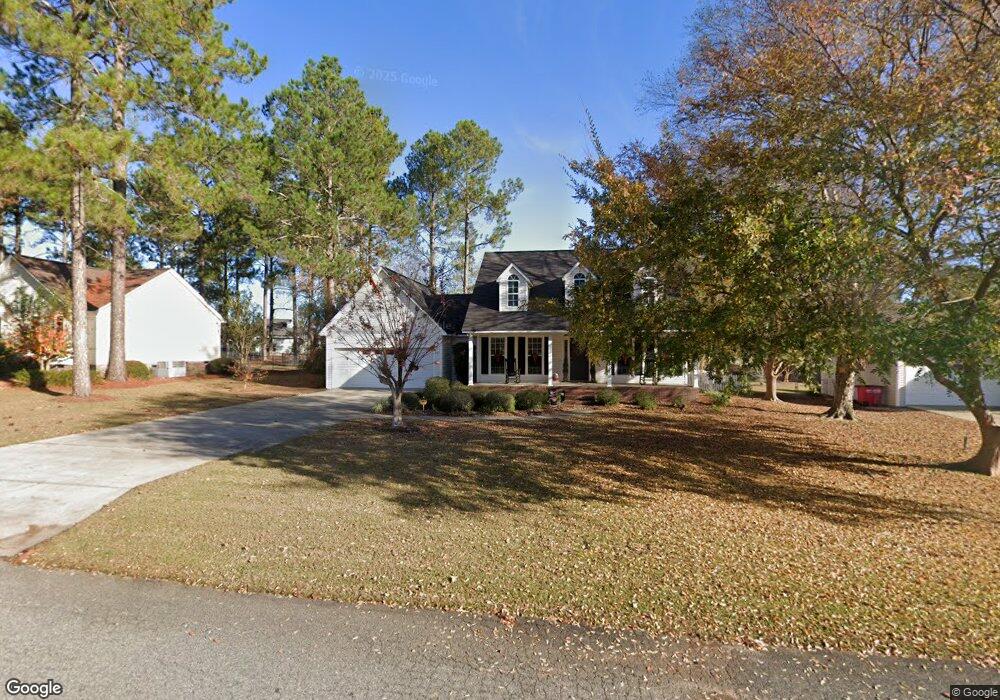
607 46th St E Tifton, GA 31794
Estimated Value: $257,104 - $283,000
3
Beds
2
Baths
1,552
Sq Ft
$176/Sq Ft
Est. Value
About This Home
This home is located at 607 46th St E, Tifton, GA 31794 and is currently estimated at $273,701, approximately $176 per square foot. 607 46th St E is a home located in Tift County with nearby schools including Northside Primary School, Charles Spencer Elementary School, and J.T. Reddick School.
Ownership History
Date
Name
Owned For
Owner Type
Purchase Details
Closed on
Jul 6, 2018
Sold by
Branch Jerry Mack Jerry Mack
Bought by
Gardner Brian
Current Estimated Value
Home Financials for this Owner
Home Financials are based on the most recent Mortgage that was taken out on this home.
Original Mortgage
$158,585
Outstanding Balance
$135,986
Interest Rate
4.5%
Mortgage Type
New Conventional
Estimated Equity
$137,715
Purchase Details
Closed on
Jul 17, 2009
Sold by
Davis Russell Y
Bought by
Branch Jerry Mack
Home Financials for this Owner
Home Financials are based on the most recent Mortgage that was taken out on this home.
Original Mortgage
$146,500
Interest Rate
5.37%
Mortgage Type
New Conventional
Purchase Details
Closed on
Feb 21, 2003
Sold by
Gann Todd D and Gann Ameila M
Bought by
Davis Russell Y and Davis Kirkland,Monica R
Purchase Details
Closed on
Apr 1, 1999
Sold by
Southeastern Constructio
Bought by
Gann Todd D
Purchase Details
Closed on
Jan 7, 1998
Sold by
Adcock Robert D
Bought by
Southeastern Constructio
Create a Home Valuation Report for This Property
The Home Valuation Report is an in-depth analysis detailing your home's value as well as a comparison with similar homes in the area
Purchase History
| Date | Buyer | Sale Price | Title Company |
|---|---|---|---|
| Gardner Brian | $157,000 | -- | |
| Branch Jerry Mack | $146,999 | -- | |
| Davis Russell Y | $128,500 | -- | |
| Gann Todd D | $118,500 | -- | |
| Southeastern Constructio | $120,000 | -- |
Source: Public Records
Mortgage History
| Date | Status | Borrower | Loan Amount |
|---|---|---|---|
| Open | Gardner Brian | $158,585 | |
| Previous Owner | Branch Jerry Mack | $146,500 |
Source: Public Records
Tax History
| Year | Tax Paid | Tax Assessment Tax Assessment Total Assessment is a certain percentage of the fair market value that is determined by local assessors to be the total taxable value of land and additions on the property. | Land | Improvement |
|---|---|---|---|---|
| 2025 | $2,422 | $93,688 | $10,000 | $83,688 |
| 2024 | $2,422 | $93,688 | $10,000 | $83,688 |
| 2023 | $2,578 | $63,633 | $8,000 | $55,633 |
| 2022 | $2,245 | $63,633 | $8,000 | $55,633 |
| 2021 | $2,260 | $63,633 | $8,000 | $55,633 |
| 2020 | $1,918 | $53,416 | $8,000 | $45,416 |
| 2019 | $1,919 | $53,416 | $8,000 | $45,416 |
| 2018 | $1,920 | $53,416 | $8,000 | $45,416 |
| 2017 | $1,971 | $53,416 | $8,000 | $45,416 |
| 2016 | $1,974 | $53,416 | $8,000 | $45,416 |
| 2015 | $1,976 | $53,416 | $8,000 | $45,416 |
| 2014 | $1,979 | $53,416 | $8,000 | $45,416 |
| 2013 | -- | $53,416 | $8,000 | $45,416 |
Source: Public Records
Map
Nearby Homes
- 603 48th St
- 346 Somers Ln
- 603 40th St E
- 909 E 46th St
- 2612 Goff St
- 2417 Belmont Ave
- 0 Belflower Rd Unit 25624433
- 0 Belflower Rd Unit 139026
- 0 Belflower Rd Unit 24022932
- 0 Belflower Rd Unit 138547
- 0 Belflower Rd Unit 10554704
- 2209 Meadowbrook Dr
- 2214 Love Ave
- 2014 Davis Ave
- 2014 Tyson Ave
- 303 26th St W
- 2605 Murray Ave
- 502 20th St E
- 2615 Hall Ave
- -0- Old Ocilla Rd
Your Personal Tour Guide
Ask me questions while you tour the home.