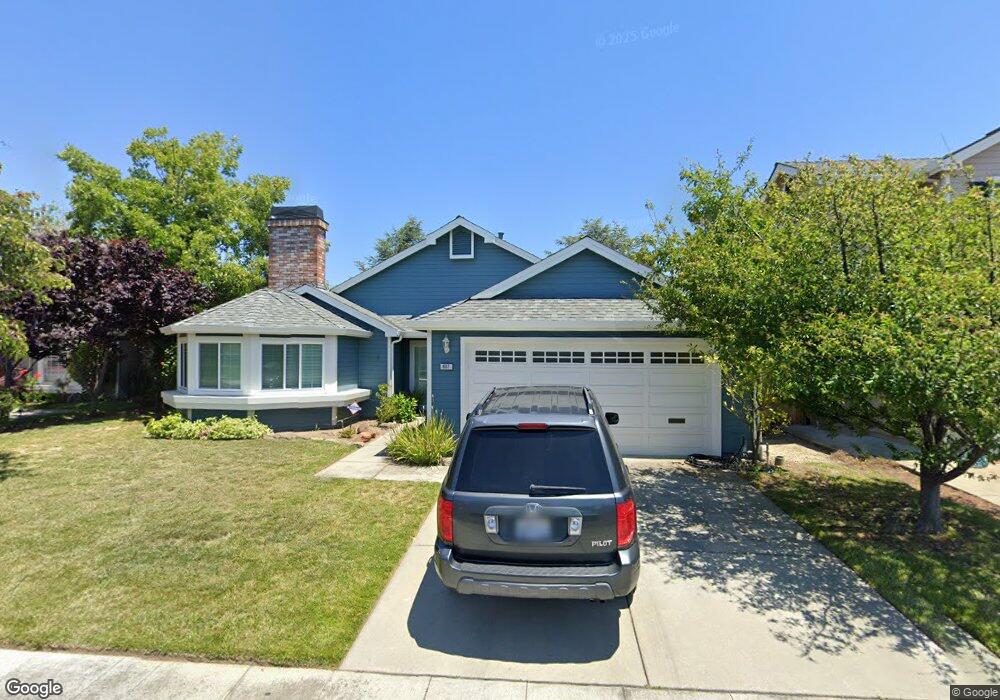
607 Anacapa Ln Foster City, CA 94404
Sea Colony NeighborhoodEstimated Value: $2,258,000 - $2,613,000
2
Beds
2
Baths
1,940
Sq Ft
$1,226/Sq Ft
Est. Value
About This Home
This home is located at 607 Anacapa Ln, Foster City, CA 94404 and is currently estimated at $2,378,263, approximately $1,225 per square foot. 607 Anacapa Ln is a home located in San Mateo County with nearby schools including Foster City Elementary School, Bowditch Middle School, and San Mateo High School.
Ownership History
Date
Name
Owned For
Owner Type
Purchase Details
Closed on
Nov 20, 2021
Sold by
Moussa Sallie S
Bought by
Moussa Sallie S
Current Estimated Value
Purchase Details
Closed on
Aug 18, 2016
Sold by
Moussa Morris J
Bought by
Moussa Sallie S
Home Financials for this Owner
Home Financials are based on the most recent Mortgage that was taken out on this home.
Original Mortgage
$1,035,000
Outstanding Balance
$813,770
Interest Rate
3.12%
Mortgage Type
Adjustable Rate Mortgage/ARM
Estimated Equity
$1,564,493
Purchase Details
Closed on
Jul 15, 2004
Sold by
Kleid Dennis G and Kleid Michelle M
Bought by
Moussa Morris J and Moussa Sallie S
Home Financials for this Owner
Home Financials are based on the most recent Mortgage that was taken out on this home.
Original Mortgage
$678,750
Interest Rate
4.87%
Mortgage Type
Purchase Money Mortgage
Purchase Details
Closed on
Jun 24, 1994
Sold by
Kleid Dennis G and Kleid Michelle M
Bought by
Kleid Dennis G and Kleid Michelle M
Create a Home Valuation Report for This Property
The Home Valuation Report is an in-depth analysis detailing your home's value as well as a comparison with similar homes in the area
Home Values in the Area
Average Home Value in this Area
Purchase History
| Date | Buyer | Sale Price | Title Company |
|---|---|---|---|
| Moussa Sallie S | -- | Chicago Title Company | |
| Moussa Sallie S | -- | None Available | |
| Moussa Morris J | $905,000 | North American Title Co | |
| Kleid Dennis G | -- | -- |
Source: Public Records
Mortgage History
| Date | Status | Borrower | Loan Amount |
|---|---|---|---|
| Open | Moussa Sallie S | $1,035,000 | |
| Closed | Moussa Morris J | $678,750 |
Source: Public Records
Tax History Compared to Growth
Tax History
| Year | Tax Paid | Tax Assessment Tax Assessment Total Assessment is a certain percentage of the fair market value that is determined by local assessors to be the total taxable value of land and additions on the property. | Land | Improvement |
|---|---|---|---|---|
| 2025 | $14,758 | $1,261,478 | $630,739 | $630,739 |
| 2023 | $14,758 | $1,212,496 | $606,248 | $606,248 |
| 2022 | $14,264 | $1,188,722 | $594,361 | $594,361 |
| 2021 | $14,080 | $1,165,414 | $582,707 | $582,707 |
| 2020 | $13,694 | $1,153,466 | $576,733 | $576,733 |
| 2019 | $12,976 | $1,130,850 | $565,425 | $565,425 |
| 2018 | $12,454 | $1,108,678 | $554,339 | $554,339 |
| 2017 | $12,315 | $1,086,940 | $543,470 | $543,470 |
| 2016 | $12,190 | $1,065,628 | $532,814 | $532,814 |
| 2015 | $11,985 | $1,049,622 | $524,811 | $524,811 |
| 2014 | $11,681 | $1,029,062 | $514,531 | $514,531 |
Source: Public Records
Map
Nearby Homes
- 707 Santa Cruz Ln
- 1024 Rudder Ln
- 910 Beach Park Blvd Unit 106
- 910 Beach Park Blvd Unit 97
- 619 Mystic Ln
- 26 Binnacle Ln
- 1017 Shell Blvd Unit 12
- 1041 Shell Blvd Unit 8
- 851 Peary Ln
- 1171 Compass Ln Unit 211
- 971 Marquette Ln
- 101 Shorebird Cir
- 203 Shorebird Cir
- 803 Peary Ln
- 986 Cartier Ln
- 667 Sandy Hook Ct
- 879 Carina Ln
- 1061 Beach Park Blvd Unit 216
- 1131 Compass Ln Unit 108
- 816 Corriente Point Dr