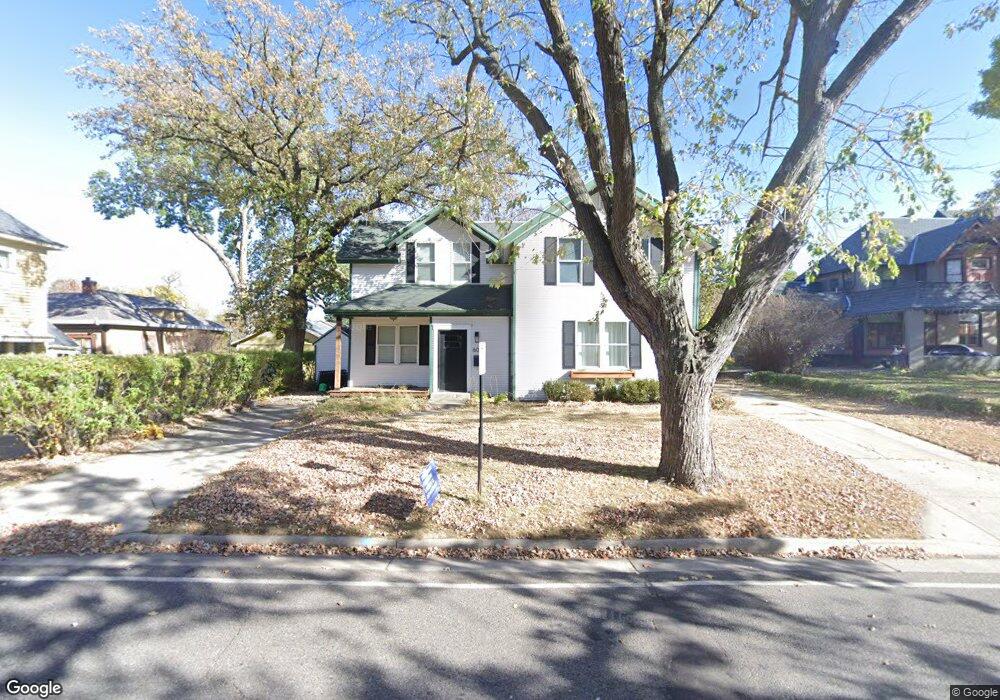
607 Cedar St Unit 609 Alexandria, MN 56308
Estimated Value: $186,000 - $281,000
--
Bed
--
Bath
871
Sq Ft
$254/Sq Ft
Est. Value
About This Home
This home is located at 607 Cedar St Unit 609, Alexandria, MN 56308 and is currently estimated at $221,168, approximately $253 per square foot. 607 Cedar St Unit 609 is a home located in Douglas County with nearby schools including Lincoln Elementary School, Discovery Middle School, and Alexandria Area High School.
Ownership History
Date
Name
Owned For
Owner Type
Purchase Details
Closed on
Apr 22, 2022
Sold by
Thompson Theodore and Thompson Melani
Bought by
Henrich Eliza and Henrich Hans
Current Estimated Value
Home Financials for this Owner
Home Financials are based on the most recent Mortgage that was taken out on this home.
Original Mortgage
$135,000
Outstanding Balance
$126,261
Interest Rate
3.85%
Mortgage Type
New Conventional
Estimated Equity
$94,907
Purchase Details
Closed on
Aug 6, 2019
Sold by
Thompson Robert L and Thompson Susan
Bought by
Thompson Theodore R and Thompson Melani K
Home Financials for this Owner
Home Financials are based on the most recent Mortgage that was taken out on this home.
Original Mortgage
$100,000
Interest Rate
3.73%
Mortgage Type
New Conventional
Purchase Details
Closed on
Jun 15, 2018
Sold by
Janke Mark E and Janke Christopher Y
Bought by
Thompson Robert L and Thompson Susan
Create a Home Valuation Report for This Property
The Home Valuation Report is an in-depth analysis detailing your home's value as well as a comparison with similar homes in the area
Home Values in the Area
Average Home Value in this Area
Purchase History
| Date | Buyer | Sale Price | Title Company |
|---|---|---|---|
| Henrich Eliza | $180,000 | -- | |
| Thompson Theodore R | $115,000 | Alexandria Title Co | |
| Thompson Robert L | $32,000 | None Available |
Source: Public Records
Mortgage History
| Date | Status | Borrower | Loan Amount |
|---|---|---|---|
| Open | Henrich Eliza | $135,000 | |
| Previous Owner | Thompson Theodore R | $100,000 |
Source: Public Records
Tax History Compared to Growth
Tax History
| Year | Tax Paid | Tax Assessment Tax Assessment Total Assessment is a certain percentage of the fair market value that is determined by local assessors to be the total taxable value of land and additions on the property. | Land | Improvement |
|---|---|---|---|---|
| 2025 | $1,770 | $198,100 | $31,500 | $166,600 |
| 2024 | $1,770 | $191,000 | $30,000 | $161,000 |
| 2023 | $1,808 | $178,400 | $30,000 | $148,400 |
| 2022 | $1,266 | $131,300 | $28,000 | $103,300 |
| 2021 | $1,208 | $119,600 | $28,000 | $91,600 |
| 2020 | $1,174 | $113,800 | $28,000 | $85,800 |
| 2019 | $1,384 | $108,800 | $28,000 | $80,800 |
| 2018 | $1,292 | $103,700 | $28,000 | $75,700 |
| 2017 | $1,224 | $99,700 | $28,000 | $71,700 |
| 2016 | -- | $94,187 | $27,160 | $67,027 |
| 2015 | $1,250 | $0 | $0 | $0 |
| 2014 | -- | $91,200 | $28,000 | $63,200 |
Source: Public Records
Map
Nearby Homes
- 417 6th Ave W
- 511 Douglas St
- 411 Elm St
- 922 Fillmore St
- 1014 Elm St
- 323 Fairgrounds Rd Unit 4
- 323 1/2 Unit 3 Fairgrounds Rd N
- 301 8th Ave E
- 1122 Fillmore St
- 217 10th Ave E
- 1017 Hawthorne St
- 1023 Hawthorne St
- 719 Jefferson St
- 401 Jefferson St
- 415 7th Ave E
- 1225 Lark St
- 1012 Jefferson St
- 410 10th Ave E
- 1105 Jefferson St
- 1407 Elm St
- 424 6th Ave W
- 421 7th Ave W
- 416 6th Ave W
- 608 Cedar St
- 504 6th Ave W
- 505 7th Ave W
- 405 7th Ave W
- 406 6th Ave W
- 422 7th Ave W
- 422 422 7th-Avenue-w
- 405 6th Ave W
- 5 Fairgrounds Rd
- 518 6th Ave W
- 511 Cedar St
- 704 Douglas St
- 509 6th Ave W
- 323 7th Ave W
- 509 6th Ave W Unit 212
- 509 6th Ave W Unit 211
- 509 6th Ave W Unit 210