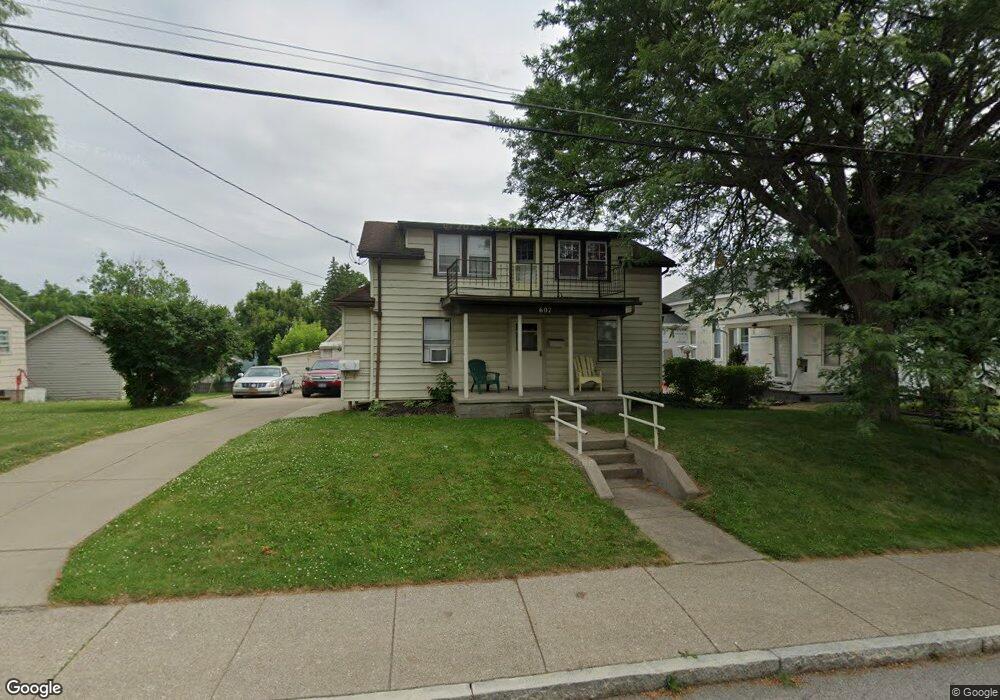
607 Main St West Seneca, NY 14224
Estimated Value: $184,000 - $283,000
3
Beds
2
Baths
1,596
Sq Ft
$145/Sq Ft
Est. Value
About This Home
This home is located at 607 Main St, West Seneca, NY 14224 and is currently estimated at $230,650, approximately $144 per square foot. 607 Main St is a home located in Erie County with nearby schools including East Middle School, West Seneca East Senior High School, and Queen Of Heaven Elementary School.
Ownership History
Date
Name
Owned For
Owner Type
Purchase Details
Closed on
Mar 30, 2011
Sold by
Torzewski Michelle and Torzewski Denise
Bought by
Baker Charles J
Current Estimated Value
Home Financials for this Owner
Home Financials are based on the most recent Mortgage that was taken out on this home.
Original Mortgage
$8,000
Outstanding Balance
$5,581
Interest Rate
5.04%
Mortgage Type
Seller Take Back
Estimated Equity
$225,069
Purchase Details
Closed on
Sep 12, 2000
Sold by
Snyder Eleanor C
Bought by
Torzewski Daniel J and Torzewski Marie Alice
Create a Home Valuation Report for This Property
The Home Valuation Report is an in-depth analysis detailing your home's value as well as a comparison with similar homes in the area
Home Values in the Area
Average Home Value in this Area
Purchase History
| Date | Buyer | Sale Price | Title Company |
|---|---|---|---|
| Baker Charles J | $70,000 | None Available | |
| Torzewski Daniel J | $400 | -- |
Source: Public Records
Mortgage History
| Date | Status | Borrower | Loan Amount |
|---|---|---|---|
| Open | Baker Charles J | $8,000 |
Source: Public Records
Tax History
| Year | Tax Paid | Tax Assessment Tax Assessment Total Assessment is a certain percentage of the fair market value that is determined by local assessors to be the total taxable value of land and additions on the property. | Land | Improvement |
|---|---|---|---|---|
| 2024 | $4,548 | $45,400 | $5,700 | $39,700 |
| 2023 | $4,731 | $45,400 | $5,700 | $39,700 |
| 2022 | $4,685 | $45,400 | $5,700 | $39,700 |
| 2021 | $4,654 | $45,400 | $5,700 | $39,700 |
| 2020 | $4,498 | $45,400 | $5,700 | $39,700 |
| 2019 | $3,962 | $45,400 | $5,700 | $39,700 |
| 2018 | $4,345 | $45,400 | $5,700 | $39,700 |
| 2017 | $2,002 | $45,400 | $5,700 | $39,700 |
| 2016 | $4,010 | $45,400 | $5,700 | $39,700 |
| 2015 | -- | $45,400 | $5,700 | $39,700 |
| 2014 | -- | $45,400 | $5,700 | $39,700 |
Source: Public Records
Map
Nearby Homes
Your Personal Tour Guide
Ask me questions while you tour the home.