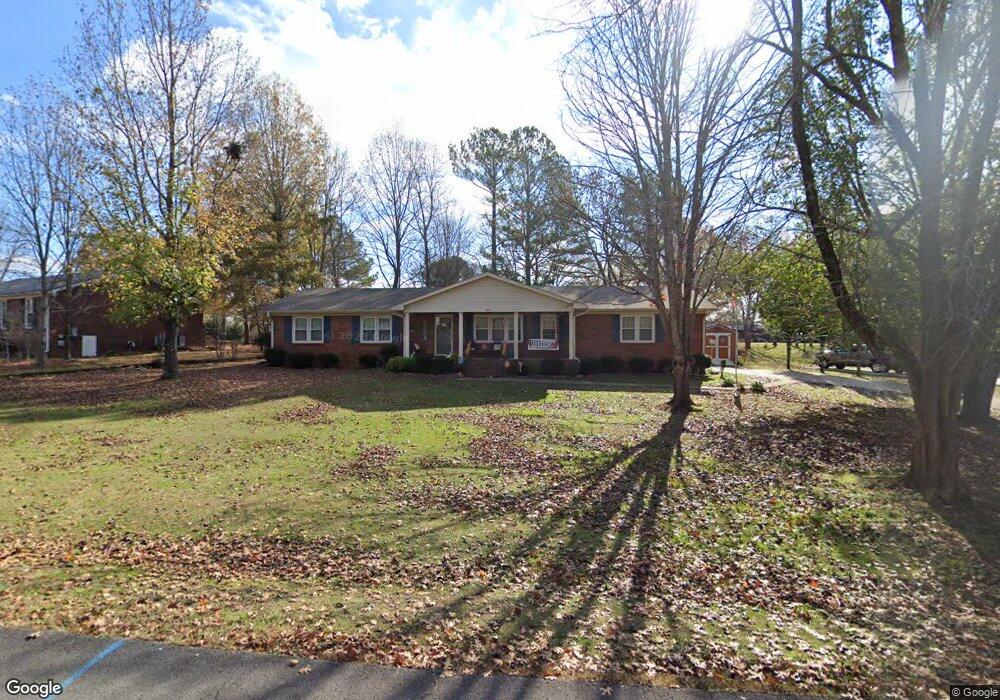
607 Midway St Lewisburg, TN 37091
Estimated Value: $271,473 - $345,000
--
Bed
2
Baths
1,782
Sq Ft
$177/Sq Ft
Est. Value
About This Home
This home is located at 607 Midway St, Lewisburg, TN 37091 and is currently estimated at $314,868, approximately $176 per square foot. 607 Midway St is a home located in Marshall County with nearby schools including Marshall Elementary School, Oak Grove Elementary School, and Westhills Elementary School.
Ownership History
Date
Name
Owned For
Owner Type
Purchase Details
Closed on
Aug 22, 2018
Sold by
Turner Elsie D
Bought by
Shelton Samuel M and Shelton Betsy
Current Estimated Value
Home Financials for this Owner
Home Financials are based on the most recent Mortgage that was taken out on this home.
Original Mortgage
$176,778
Interest Rate
4.5%
Mortgage Type
Commercial
Purchase Details
Closed on
Oct 9, 1987
Bought by
Turner Robert N and Turner Elsie D.
Create a Home Valuation Report for This Property
The Home Valuation Report is an in-depth analysis detailing your home's value as well as a comparison with similar homes in the area
Home Values in the Area
Average Home Value in this Area
Purchase History
| Date | Buyer | Sale Price | Title Company |
|---|---|---|---|
| Shelton Samuel M | $172,000 | -- | |
| Turner Robert N | $65,000 | -- |
Source: Public Records
Mortgage History
| Date | Status | Borrower | Loan Amount |
|---|---|---|---|
| Closed | Shelton Samuel M | $176,778 |
Source: Public Records
Tax History Compared to Growth
Tax History
| Year | Tax Paid | Tax Assessment Tax Assessment Total Assessment is a certain percentage of the fair market value that is determined by local assessors to be the total taxable value of land and additions on the property. | Land | Improvement |
|---|---|---|---|---|
| 2024 | -- | $56,800 | $8,750 | $48,050 |
| 2023 | $1,763 | $56,800 | $8,750 | $48,050 |
| 2022 | $1,763 | $56,800 | $8,750 | $48,050 |
| 2021 | $1,586 | $34,100 | $4,750 | $29,350 |
| 2020 | $1,586 | $34,100 | $4,750 | $29,350 |
| 2019 | $1,536 | $34,100 | $4,750 | $29,350 |
| 2018 | $1,519 | $34,100 | $4,750 | $29,350 |
| 2017 | $1,519 | $34,100 | $4,750 | $29,350 |
| 2016 | $1,453 | $28,375 | $4,375 | $24,000 |
| 2015 | $1,325 | $28,375 | $4,375 | $24,000 |
| 2014 | $1,325 | $28,375 | $4,375 | $24,000 |
Source: Public Records
Map
Nearby Homes