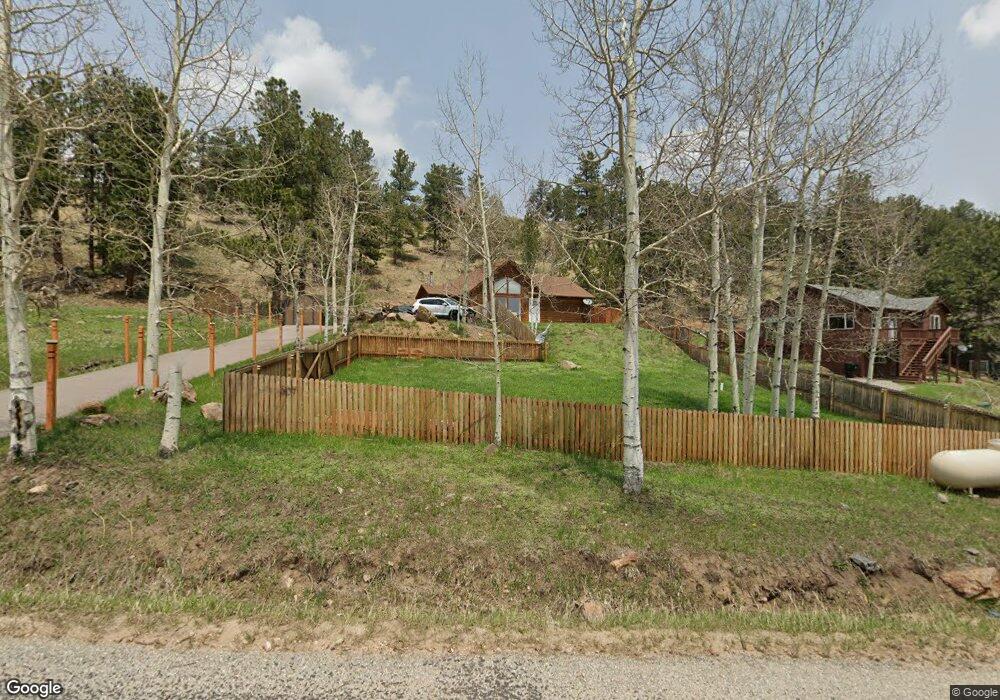
607 N Pine Dr Bailey, CO 80421
Estimated Value: $516,511 - $602,000
2
Beds
1
Bath
1,464
Sq Ft
$383/Sq Ft
Est. Value
About This Home
This home is located at 607 N Pine Dr, Bailey, CO 80421 and is currently estimated at $560,878, approximately $383 per square foot. 607 N Pine Dr is a home located in Park County with nearby schools including Deer Creek Elementary School, Fitzsimmons Middle School, and Platte Canyon High School.
Ownership History
Date
Name
Owned For
Owner Type
Purchase Details
Closed on
Dec 3, 2018
Sold by
Relseuer Scott Thomas
Bought by
Bell Susanne M
Current Estimated Value
Home Financials for this Owner
Home Financials are based on the most recent Mortgage that was taken out on this home.
Original Mortgage
$190,000
Outstanding Balance
$165,744
Interest Rate
4.8%
Mortgage Type
New Conventional
Estimated Equity
$395,134
Purchase Details
Closed on
Feb 17, 2017
Sold by
Bacon Erin
Bought by
Reisetter Scott Thomas
Home Financials for this Owner
Home Financials are based on the most recent Mortgage that was taken out on this home.
Original Mortgage
$309,853
Interest Rate
4.2%
Mortgage Type
VA
Purchase Details
Closed on
Aug 19, 2015
Sold by
Elswick Frederick L and Elswick Nancy J
Bought by
Bacon Erin
Home Financials for this Owner
Home Financials are based on the most recent Mortgage that was taken out on this home.
Original Mortgage
$220,924
Interest Rate
4.25%
Mortgage Type
FHA
Create a Home Valuation Report for This Property
The Home Valuation Report is an in-depth analysis detailing your home's value as well as a comparison with similar homes in the area
Home Values in the Area
Average Home Value in this Area
Purchase History
| Date | Buyer | Sale Price | Title Company |
|---|---|---|---|
| Bell Susanne M | $365,000 | First American Title | |
| Reisetter Scott Thomas | $299,995 | North American Title | |
| Bacon Erin | $225,000 | Land Title Guarantee Company |
Source: Public Records
Mortgage History
| Date | Status | Borrower | Loan Amount |
|---|---|---|---|
| Open | Bell Susanne M | $190,000 | |
| Previous Owner | Reisetter Scott Thomas | $309,853 | |
| Previous Owner | Bacon Erin | $220,924 |
Source: Public Records
Tax History
| Year | Tax Paid | Tax Assessment Tax Assessment Total Assessment is a certain percentage of the fair market value that is determined by local assessors to be the total taxable value of land and additions on the property. | Land | Improvement |
|---|---|---|---|---|
| 2025 | $2,082 | $32,520 | $5,870 | $26,650 |
| 2024 | $1,918 | $32,420 | $4,600 | $27,820 |
| 2023 | $1,918 | $32,420 | $4,600 | $27,820 |
| 2022 | $1,653 | $26,112 | $2,479 | $23,633 |
| 2021 | $1,640 | $26,860 | $2,550 | $24,310 |
| 2020 | $1,562 | $24,580 | $1,850 | $22,730 |
| 2019 | $1,541 | $24,580 | $1,850 | $22,730 |
| 2018 | $1,117 | $24,580 | $1,850 | $22,730 |
| 2017 | $1,116 | $17,270 | $1,620 | $15,650 |
| 2016 | $923 | $14,210 | $1,920 | $12,290 |
| 2015 | $931 | $14,210 | $1,920 | $12,290 |
| 2014 | $739 | $0 | $0 | $0 |
Source: Public Records
Map
Nearby Homes
- 560 S Pine Dr
- 104 Pinon Rd
- 201 Moss Rock Rd
- 312 S Pine Dr
- 209 Pine Dr
- 53 Deerhaven Dr
- 260 Old Corral Rd
- 502 County Road 1034
- 64057 Us Highway 285
- 1146 Tapadero Rd
- 52 Deer Trail Dr
- 3763 County Road 43
- 249 Burland Dr
- 145 Bailey Dr
- 260 Bailey Dr Unit 6
- 429 Overlook Dr
- 237 Homestead Rd
- 147 Overlook Dr
- 400 Crow Valley Rd
- 685 Jesse Ln
Your Personal Tour Guide
Ask me questions while you tour the home.