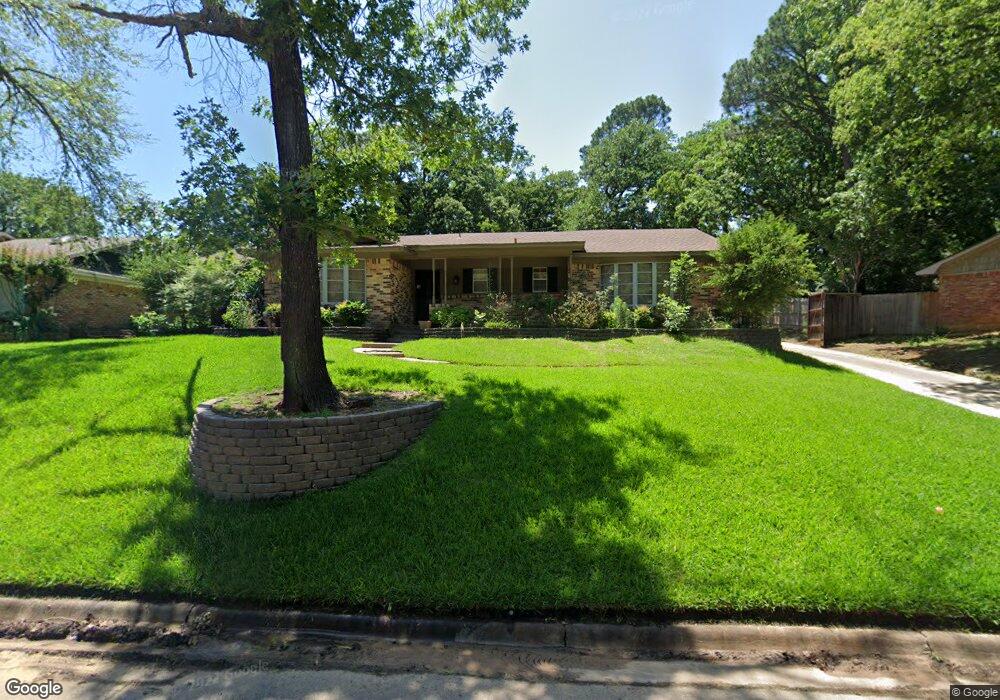
607 Royal Ridge Dr Denison, TX 75020
Estimated Value: $276,596 - $319,000
3
Beds
2
Baths
2,065
Sq Ft
$144/Sq Ft
Est. Value
About This Home
This home is located at 607 Royal Ridge Dr, Denison, TX 75020 and is currently estimated at $297,798, approximately $144 per square foot. 607 Royal Ridge Dr is a home located in Grayson County with nearby schools including Mayes Elementary School, Scott Middle School, and Denison High School.
Ownership History
Date
Name
Owned For
Owner Type
Purchase Details
Closed on
Jan 28, 2013
Sold by
Lashley Brenda K
Bought by
Pearson Jacob Ray
Current Estimated Value
Home Financials for this Owner
Home Financials are based on the most recent Mortgage that was taken out on this home.
Original Mortgage
$111,160
Interest Rate
3.42%
Mortgage Type
New Conventional
Purchase Details
Closed on
Mar 10, 2011
Sold by
Atwell Bobbie L
Bought by
Pearson Jacob R and Pearson Jessica
Home Financials for this Owner
Home Financials are based on the most recent Mortgage that was taken out on this home.
Original Mortgage
$193,500
Interest Rate
4.78%
Mortgage Type
Seller Take Back
Purchase Details
Closed on
Nov 13, 2006
Sold by
Taylor Bobby R and Taylor Gloria M
Bought by
Pearson Jacob Ray and Lashley Brenda K
Home Financials for this Owner
Home Financials are based on the most recent Mortgage that was taken out on this home.
Original Mortgage
$111,150
Interest Rate
6.26%
Mortgage Type
Purchase Money Mortgage
Create a Home Valuation Report for This Property
The Home Valuation Report is an in-depth analysis detailing your home's value as well as a comparison with similar homes in the area
Home Values in the Area
Average Home Value in this Area
Purchase History
| Date | Buyer | Sale Price | Title Company |
|---|---|---|---|
| Pearson Jacob Ray | -- | None Available | |
| Pearson Jacob R | -- | Grayson County Title | |
| Pearson Jacob Ray | -- | Grayson County Title |
Source: Public Records
Mortgage History
| Date | Status | Borrower | Loan Amount |
|---|---|---|---|
| Closed | Pearson Jacob Ray | $111,160 | |
| Previous Owner | Pearson Jacob R | $193,500 | |
| Previous Owner | Pearson Jacob Ray | $111,150 |
Source: Public Records
Tax History Compared to Growth
Tax History
| Year | Tax Paid | Tax Assessment Tax Assessment Total Assessment is a certain percentage of the fair market value that is determined by local assessors to be the total taxable value of land and additions on the property. | Land | Improvement |
|---|---|---|---|---|
| 2025 | $2,709 | $268,461 | $75,169 | $193,292 |
| 2024 | $6,035 | $259,761 | $62,344 | $197,417 |
| 2023 | $2,701 | $246,010 | $0 | $0 |
| 2022 | $5,314 | $223,645 | $0 | $0 |
| 2021 | $5,128 | $203,314 | $42,750 | $160,564 |
| 2020 | $4,969 | $188,377 | $21,494 | $166,883 |
| 2019 | $5,082 | $184,682 | $21,494 | $163,188 |
| 2018 | $4,951 | $178,478 | $17,694 | $160,784 |
| 2017 | $4,759 | $170,118 | $16,625 | $153,493 |
| 2016 | $4,366 | $156,078 | $14,844 | $141,234 |
| 2015 | $0 | $131,995 | $10,806 | $121,189 |
| 2014 | -- | $119,290 | $10,806 | $108,484 |
Source: Public Records
Map
Nearby Homes
- 612 Ambassador St
- 600 Ambassador St
- 901 Old State Ln
- 12 Ambassador Ct
- 1731 W Crawford St
- 2105 W Crawford St
- 1508 W Shepherd St
- TBD W Crawford St
- 1730 W Hull St
- 2107 Rivercrest Cir
- 901 Waterloo Lake Dr
- 1531 W Main St
- 931 Waterloo Lake Dr
- 2521 Brookhaven Dr
- 1319 W Morgan St
- 1609 W Woodard St
- 1326 W Crawford St
- 509 Bryan Dr
- 501 S Eddy Ave
- 2603 Brookhaven Dr
- 605 Royal Ridge Dr
- 609 Royal Ridge Dr
- 604 Queens Rd
- 606 Queens Rd
- 603 Royal Ridge Dr
- 610 Royal Ridge Dr
- 608 Royal Ridge Dr
- 600 Queens Rd
- 604 Royal Ridge Dr
- 608 Queens Rd
- 612 Royal Ridge Dr
- 616 Royal Ridge Dr
- 602 Royal Ridge Dr
- 618 Royal Ridge Dr
- 604 Ambassador St
- 601 Royal Ridge Dr
- 605 Queens Rd
- 607 Queens Rd
- 603 Queens Rd
- 610 Queens Rd