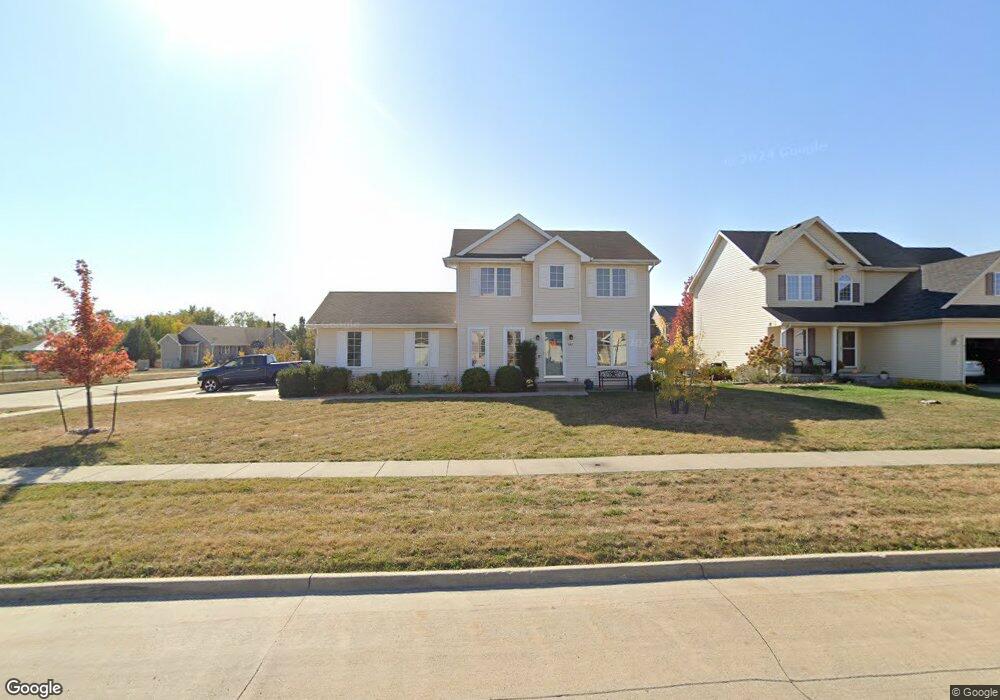
607 SW 48th St Ankeny, IA 50023
Southwest Ankeny NeighborhoodEstimated Value: $327,000 - $345,715
3
Beds
4
Baths
1,590
Sq Ft
$210/Sq Ft
Est. Value
About This Home
This home is located at 607 SW 48th St, Ankeny, IA 50023 and is currently estimated at $334,679, approximately $210 per square foot. 607 SW 48th St is a home located in Polk County with nearby schools including Southview Middle School, Parkview Middle School, and Ankeny High School.
Ownership History
Date
Name
Owned For
Owner Type
Purchase Details
Closed on
Feb 1, 2006
Sold by
Northwood Homes Llc
Bought by
Potter Shad A and Mayrhofer Petra F
Current Estimated Value
Home Financials for this Owner
Home Financials are based on the most recent Mortgage that was taken out on this home.
Original Mortgage
$16,500
Interest Rate
5.93%
Mortgage Type
Fannie Mae Freddie Mac
Create a Home Valuation Report for This Property
The Home Valuation Report is an in-depth analysis detailing your home's value as well as a comparison with similar homes in the area
Home Values in the Area
Average Home Value in this Area
Purchase History
| Date | Buyer | Sale Price | Title Company |
|---|---|---|---|
| Potter Shad A | $170,500 | None Available |
Source: Public Records
Mortgage History
| Date | Status | Borrower | Loan Amount |
|---|---|---|---|
| Closed | Potter Shad A | $16,500 | |
| Open | Potter Shad A | $136,700 |
Source: Public Records
Tax History Compared to Growth
Tax History
| Year | Tax Paid | Tax Assessment Tax Assessment Total Assessment is a certain percentage of the fair market value that is determined by local assessors to be the total taxable value of land and additions on the property. | Land | Improvement |
|---|---|---|---|---|
| 2025 | $5,204 | $349,700 | $64,000 | $285,700 |
| 2024 | $5,204 | $315,700 | $58,600 | $257,100 |
| 2023 | $4,982 | $315,700 | $58,600 | $257,100 |
| 2022 | $4,928 | $249,200 | $47,500 | $201,700 |
| 2021 | $4,976 | $249,200 | $47,500 | $201,700 |
| 2020 | $4,910 | $237,500 | $45,400 | $192,100 |
| 2019 | $4,722 | $237,500 | $45,400 | $192,100 |
| 2018 | $4,708 | $218,200 | $40,800 | $177,400 |
| 2017 | $4,388 | $218,200 | $40,800 | $177,400 |
| 2016 | $4,382 | $192,500 | $35,700 | $156,800 |
| 2015 | $4,382 | $192,500 | $35,700 | $156,800 |
| 2014 | $4,224 | $185,800 | $34,800 | $151,000 |
Source: Public Records
Map
Nearby Homes
- 818 SW 46th St
- 827 SW 46th St
- 402 SW 48th St
- 407 SW Springfield Dr
- 126 SW 36th Ln
- 3803 SW Franklin Dr
- 4103 SW Westview Dr
- Chester Plan at Greens at Woodland Hills
- Cedar Plan at Greens at Woodland Hills
- Jasmine Plan at Greens at Woodland Hills
- Forrester Plan at Greens at Woodland Hills
- Hampton Plan at Greens at Woodland Hills
- Melrose Plan at Greens at Woodland Hills
- Lansing Plan at Greens at Woodland Hills
- Fraser Plan at Greens at Woodland Hills
- Remson Plan at Greens at Woodland Hills
- Fostoria Plan at Greens at Woodland Hills
- Chariton Plan at Greens at Woodland Hills
- TBD N Baseline St
- 611 SW 48th St
- 612 SW 50th St
- 703 SW 48th St
- 525 SW 48th St
- 620 SW 50th St
- 606 SW 48th St
- 610 SW 48th St
- 602 SW 48th St
- 707 SW 48th St
- 704 SW 50th St
- 614 SW 48th St
- 521 SW 48th St
- 528 SW 48th St
- 611 SW 50th St
- 702 SW 48th St
- 708 SW 50th St
- 711 SW 48th St
- 524 SW 48th St
- 615 SW 50th St
- 5003 SW Wildflower Dr