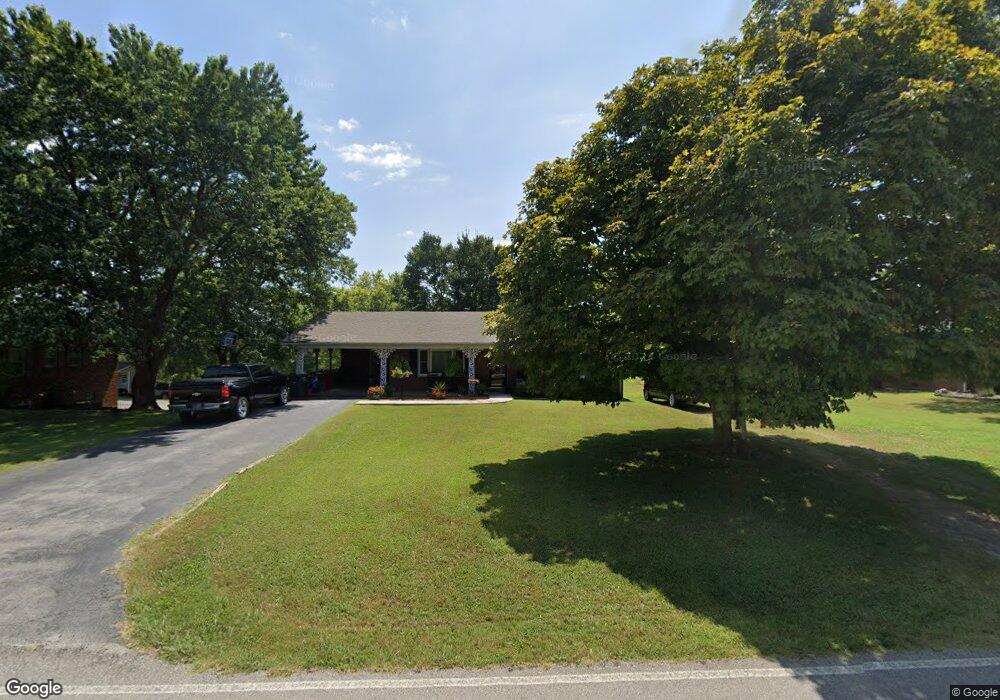
607 Turn Table Rd Sparta, TN 38583
Estimated Value: $201,000 - $306,000
--
Bed
2
Baths
1,629
Sq Ft
$159/Sq Ft
Est. Value
About This Home
This home is located at 607 Turn Table Rd, Sparta, TN 38583 and is currently estimated at $259,497, approximately $159 per square foot. 607 Turn Table Rd is a home located in White County with nearby schools including Findlay Elementary School, White County Middle School, and White County High School.
Ownership History
Date
Name
Owned For
Owner Type
Purchase Details
Closed on
Sep 19, 2019
Sold by
Bardy William Carl
Bought by
Brady Kayla L and Brady William Clayton
Current Estimated Value
Home Financials for this Owner
Home Financials are based on the most recent Mortgage that was taken out on this home.
Original Mortgage
$95,454
Outstanding Balance
$83,243
Interest Rate
3.6%
Mortgage Type
New Conventional
Estimated Equity
$176,254
Purchase Details
Closed on
Oct 20, 1997
Sold by
Brady William C
Bought by
Brady William C
Purchase Details
Closed on
Jul 22, 1997
Bought by
Brady William C
Purchase Details
Closed on
May 16, 1990
Bought by
Brady William C and Brady Dana N
Purchase Details
Closed on
Apr 23, 1990
Bought by
Gallaher Charles M and Mary Sue
Purchase Details
Closed on
Jul 1, 1986
Bought by
Gallaher Charles M and Mary Sue
Purchase Details
Closed on
Jun 27, 1986
Purchase Details
Closed on
Jan 2, 1900
Create a Home Valuation Report for This Property
The Home Valuation Report is an in-depth analysis detailing your home's value as well as a comparison with similar homes in the area
Home Values in the Area
Average Home Value in this Area
Purchase History
| Date | Buyer | Sale Price | Title Company |
|---|---|---|---|
| Brady Kayla L | $90,000 | None Available | |
| Brady William C | -- | -- | |
| Brady William C | -- | -- | |
| Brady William C | $44,500 | -- | |
| Gallaher Charles M | -- | -- | |
| Gallaher Charles M | -- | -- | |
| -- | $35,000 | -- | |
| -- | -- | -- |
Source: Public Records
Mortgage History
| Date | Status | Borrower | Loan Amount |
|---|---|---|---|
| Open | Brady Kayla L | $95,454 |
Source: Public Records
Tax History Compared to Growth
Tax History
| Year | Tax Paid | Tax Assessment Tax Assessment Total Assessment is a certain percentage of the fair market value that is determined by local assessors to be the total taxable value of land and additions on the property. | Land | Improvement |
|---|---|---|---|---|
| 2025 | -- | $72,975 | $0 | $0 |
| 2024 | -- | $34,650 | $3,500 | $31,150 |
| 2023 | $1,095 | $34,650 | $3,500 | $31,150 |
| 2022 | $1,095 | $36,875 | $3,500 | $33,375 |
| 2021 | $1,095 | $36,875 | $3,500 | $33,375 |
| 2020 | $1,095 | $36,875 | $3,500 | $33,375 |
| 2019 | $826 | $26,625 | $3,000 | $23,625 |
| 2018 | $826 | $26,625 | $3,000 | $23,625 |
| 2017 | $826 | $26,625 | $3,000 | $23,625 |
| 2016 | $826 | $26,625 | $3,000 | $23,625 |
| 2015 | $772 | $26,625 | $3,000 | $23,625 |
| 2014 | -- | $26,625 | $3,000 | $23,625 |
| 2013 | -- | $28,350 | $3,000 | $25,350 |
Source: Public Records
Map
Nearby Homes
- 548 Turntable Rd
- 548 Turn Table Rd
- 613 Hale St
- 00 N Spring St
- 0 Roberts Matthews Hwy
- 00 Roberts Matthews Hwy
- 0 Millers Point Rd
- 731 Howell St
- 235 Dairy Barn
- 671 N Spring St
- 202 Gillen Dr
- 210 Gillen Dr
- 1178 Ray Broyles Rd
- 249 N Spring St
- 1945 Golden Mountain Rd
- 611 Imperial Dr
- 936 N Spring St
- 3035 Monterey Hwy
- 0 Moore St
- 23 Acres Moore St
- 611 Turn Table Rd
- 603 Turn Table Rd
- 603 Turntable Rd
- 610 Madison Ave
- 615 Turn Table Rd
- 615 Turntable Rd
- 600 Madison Ave
- 597 Turntable Rd
- 597 Turn Table Rd
- 606 Turntable Rd
- .5 acres Madison Ave
- 606 Turn Table Rd
- 619 Turn Table Rd
- 619 Turntable Rd
- 157 Greenwood St
- 622 Madison Ave
- 614 Turn Table Rd
- 595 Turntable Rd
- 516 Madison Ave
- 611 Madison Ave