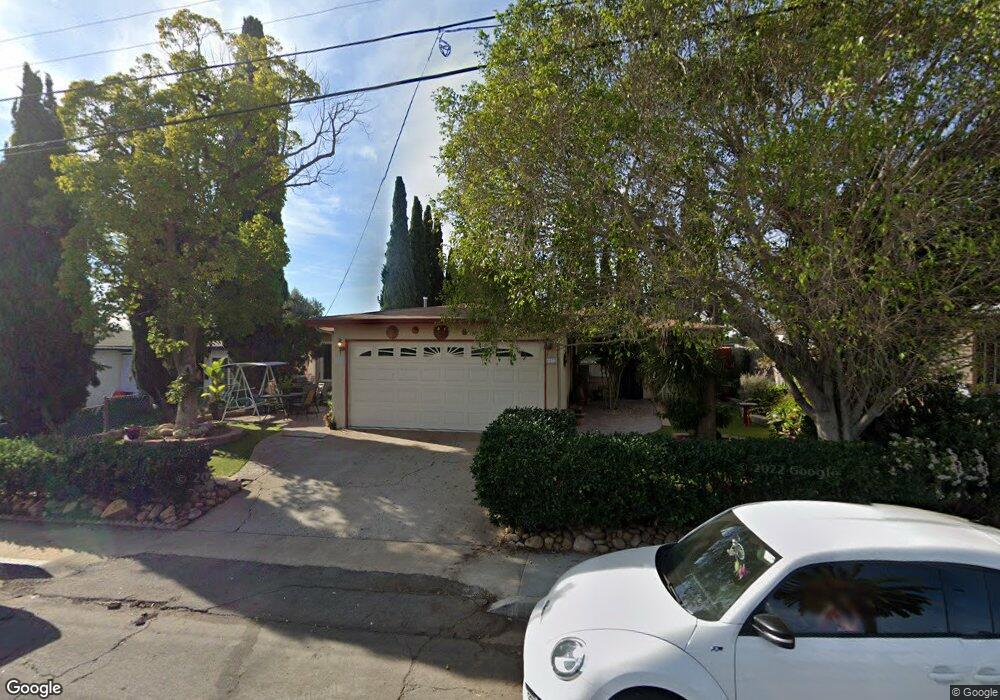
6070 Nancy Dr Unit 72 La Mesa, CA 91942
Fletcher Hills NeighborhoodEstimated Value: $755,466 - $949,000
4
Beds
2
Baths
1,400
Sq Ft
$636/Sq Ft
Est. Value
About This Home
This home is located at 6070 Nancy Dr Unit 72, La Mesa, CA 91942 and is currently estimated at $890,117, approximately $635 per square foot. 6070 Nancy Dr Unit 72 is a home located in San Diego County with nearby schools including Northmont Elementary School, Parkway Academy, and Grossmont High School.
Ownership History
Date
Name
Owned For
Owner Type
Purchase Details
Closed on
Oct 27, 2010
Sold by
Waggener Harlie J
Bought by
Waggener Harlie J
Current Estimated Value
Home Financials for this Owner
Home Financials are based on the most recent Mortgage that was taken out on this home.
Original Mortgage
$121,000
Outstanding Balance
$80,078
Interest Rate
4.33%
Mortgage Type
New Conventional
Estimated Equity
$810,039
Purchase Details
Closed on
Nov 6, 2003
Sold by
Waggener Harlie J
Bought by
Waggener Harlie J
Purchase Details
Closed on
Jul 26, 1999
Sold by
Miroslav Milovancev
Bought by
Waggener Harlie J
Home Financials for this Owner
Home Financials are based on the most recent Mortgage that was taken out on this home.
Original Mortgage
$144,800
Interest Rate
7.89%
Purchase Details
Closed on
Feb 4, 1999
Sold by
Miroslav Milovancev
Bought by
Milovancev Miroslav and Milovancev Mirjana
Create a Home Valuation Report for This Property
The Home Valuation Report is an in-depth analysis detailing your home's value as well as a comparison with similar homes in the area
Home Values in the Area
Average Home Value in this Area
Purchase History
| Date | Buyer | Sale Price | Title Company |
|---|---|---|---|
| Waggener Harlie J | -- | Accommodation | |
| Waggener Harlie J | -- | Ticor Title Company Of Ca | |
| Waggener Harlie J | -- | -- | |
| Waggener Harlie J | $181,000 | First American Title Ins Co | |
| Milovancev Miroslav | -- | -- |
Source: Public Records
Mortgage History
| Date | Status | Borrower | Loan Amount |
|---|---|---|---|
| Open | Waggener Harlie J | $121,000 | |
| Previous Owner | Waggener Harlie J | $144,800 |
Source: Public Records
Tax History
| Year | Tax Paid | Tax Assessment Tax Assessment Total Assessment is a certain percentage of the fair market value that is determined by local assessors to be the total taxable value of land and additions on the property. | Land | Improvement |
|---|---|---|---|---|
| 2025 | $3,821 | $278,172 | $130,634 | $147,538 |
| 2024 | $3,821 | $272,719 | $128,073 | $144,646 |
| 2023 | $3,740 | $267,372 | $125,562 | $141,810 |
| 2022 | $3,713 | $262,130 | $123,100 | $139,030 |
| 2021 | $3,699 | $256,991 | $120,687 | $136,304 |
| 2020 | $3,675 | $254,357 | $119,450 | $134,907 |
| 2019 | $3,675 | $249,370 | $117,108 | $132,262 |
| 2018 | $3,666 | $244,481 | $114,812 | $129,669 |
| 2017 | $3,695 | $239,688 | $112,561 | $127,127 |
| 2016 | $3,634 | $234,989 | $110,354 | $124,635 |
| 2015 | $3,673 | $231,460 | $108,697 | $122,763 |
| 2014 | $3,615 | $226,927 | $106,568 | $120,359 |
Source: Public Records
Map
Nearby Homes
- 6141-43 Horton Dr
- 6130 Howell Dr
- 5931 Howell Dr
- 5931 Howell Dr Unit 7
- 5750 Amaya Dr Unit 10
- 5750 Amaya Dr Unit 22
- 5642 Amaya Dr Unit 98
- 6206 Falmouth Dr
- 9348 Horton Dr
- 9218 Briercrest Dr
- 5941 Lubbock Ave
- 8741 Crockett St
- 1894 Wedgemere Rd
- 6375 Primrose Dr
- 6070 Odessa Ave
- 0 Grossmont Unit PTP2505998
- 5410 Bishops Way
- 5847 Amarillo Ave
- 6266 Lake Aral Dr
- 9608 Sunset Ave
- 6060 Nancy Dr
- 6060-62 Nancy Dr
- 6060 Nancy Dr
- 6080 Nancy Dr Unit 82
- 6081 Horton Dr Unit Casita
- 6081 Horton Dr
- 6081-83 Horton Dr
- 6071 Horton Dr Unit 73
- 6050 Nancy Dr Unit 52
- 6091 Horton Dr Unit 93
- 6090 Nancy Dr Unit 92
- 6071 Nancy Dr
- 6061 Horton Dr Unit 63
- 6061 Nancy Dr
- 6101 Horton Dr Unit 3
- 6081 Nancy Dr
- 6101 Horton Dr
- 6101/6103 Horton Dr
- 6040 Nancy Dr Unit 42
- 6051 Nancy Dr
Your Personal Tour Guide
Ask me questions while you tour the home.