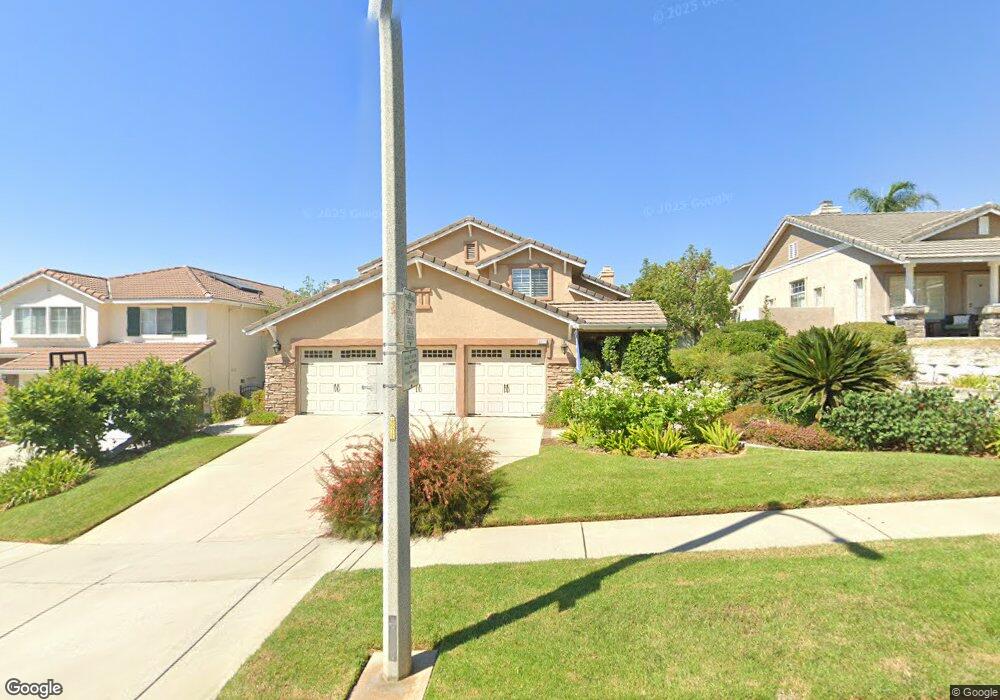
6070 San Felipe Ct Rancho Cucamonga, CA 91737
Estimated Value: $865,450 - $916,000
4
Beds
3
Baths
2,061
Sq Ft
$432/Sq Ft
Est. Value
About This Home
This home is located at 6070 San Felipe Ct, Rancho Cucamonga, CA 91737 and is currently estimated at $890,863, approximately $432 per square foot. 6070 San Felipe Ct is a home located in San Bernardino County with nearby schools including Hermosa Elementary, Vineyard Junior High, and Los Osos High.
Ownership History
Date
Name
Owned For
Owner Type
Purchase Details
Closed on
May 21, 2003
Sold by
Shinn Charles Sydney
Bought by
Shinn Charles Sydney and Shinn Mary Elizabeth
Current Estimated Value
Purchase Details
Closed on
Feb 12, 1999
Sold by
Federal Home Loan Mortgage Corporation
Bought by
Shinn Charles S and Shinn Mary E
Home Financials for this Owner
Home Financials are based on the most recent Mortgage that was taken out on this home.
Original Mortgage
$109,000
Interest Rate
6.77%
Purchase Details
Closed on
Nov 20, 1998
Sold by
Hinojosa Daniel J and Hinojosa Vanessa C
Bought by
Federal Home Loan Mortgage Corporation
Purchase Details
Closed on
Mar 8, 1996
Sold by
Sheffield Alta Loma 55 Ltd
Bought by
Hinojosa Daniel J and Hinojosa Vanessa C
Home Financials for this Owner
Home Financials are based on the most recent Mortgage that was taken out on this home.
Original Mortgage
$194,700
Interest Rate
7.41%
Create a Home Valuation Report for This Property
The Home Valuation Report is an in-depth analysis detailing your home's value as well as a comparison with similar homes in the area
Home Values in the Area
Average Home Value in this Area
Purchase History
| Date | Buyer | Sale Price | Title Company |
|---|---|---|---|
| Shinn Charles Sydney | -- | -- | |
| Shinn Charles S | $218,181 | First American Title Ins Co | |
| Federal Home Loan Mortgage Corporation | $198,000 | First American Title Ins Co | |
| Hinojosa Daniel J | $205,000 | First American Title Ins Co |
Source: Public Records
Mortgage History
| Date | Status | Borrower | Loan Amount |
|---|---|---|---|
| Closed | Shinn Charles S | $109,000 | |
| Previous Owner | Hinojosa Daniel J | $194,700 |
Source: Public Records
Tax History Compared to Growth
Tax History
| Year | Tax Paid | Tax Assessment Tax Assessment Total Assessment is a certain percentage of the fair market value that is determined by local assessors to be the total taxable value of land and additions on the property. | Land | Improvement |
|---|---|---|---|---|
| 2025 | $3,796 | $342,054 | $85,515 | $256,539 |
| 2024 | $3,796 | $335,347 | $83,838 | $251,509 |
| 2023 | $3,713 | $328,771 | $82,194 | $246,577 |
| 2022 | $3,703 | $322,324 | $80,582 | $241,742 |
| 2021 | $3,700 | $316,004 | $79,002 | $237,002 |
| 2020 | $3,554 | $312,764 | $78,192 | $234,572 |
| 2019 | $3,591 | $306,632 | $76,659 | $229,973 |
| 2018 | $3,513 | $300,620 | $75,156 | $225,464 |
| 2017 | $3,358 | $294,725 | $73,682 | $221,043 |
| 2016 | $3,270 | $288,946 | $72,237 | $216,709 |
| 2015 | $3,249 | $284,606 | $71,152 | $213,454 |
| 2014 | $3,161 | $279,031 | $69,758 | $209,273 |
Source: Public Records
Map
Nearby Homes
- 10393 Cartilla Ct
- 6162 Mayberry Ave
- 6258 Callaway Place
- 10330 Orange St
- 6281 Kinlock Ave
- 5622 Revere Ave
- 4156 4651 Liberty Vista
- 6110 Cantabria Ave
- 10655 Lemon Ave Unit 2703
- 10655 Lemon Ave Unit 2605
- 10655 Lemon Ave Unit 3613
- 10655 Lemon Ave Unit 4004
- 10655 Lemon Ave Unit 1710
- 10655 Lemon Ave Unit 4009
- 10655 Lemon Ave Unit 1508
- 10655 Lemon Ave Unit 2402
- 10655 Lemon Ave Unit 3912
- 0 Haven Unit CV23204402
- 0 Haven Unit CV23204371
- 10141 Orange St
- 6080 San Felipe Ct
- 6069 San Rafael Ct
- 6079 San Rafael Ct
- 6059 San Rafael Ct
- 6050 San Felipe Ct
- 6090 San Felipe Ct
- 6049 San Rafael Ct
- 6089 San Rafael Ct
- 6069 San Felipe Ct
- 6040 San Felipe Ct
- 6089 San Felipe Ct
- 6049 San Felipe Ct
- 6039 San Rafael Ct
- 6030 San Felipe Ct
- 6039 San Felipe Ct
- 6060 San Rafael Ct
- 6029 San Rafael Ct
- 6080 San Rafael Ct
- 6050 San Rafael Ct
- 6090 San Rafael Ct