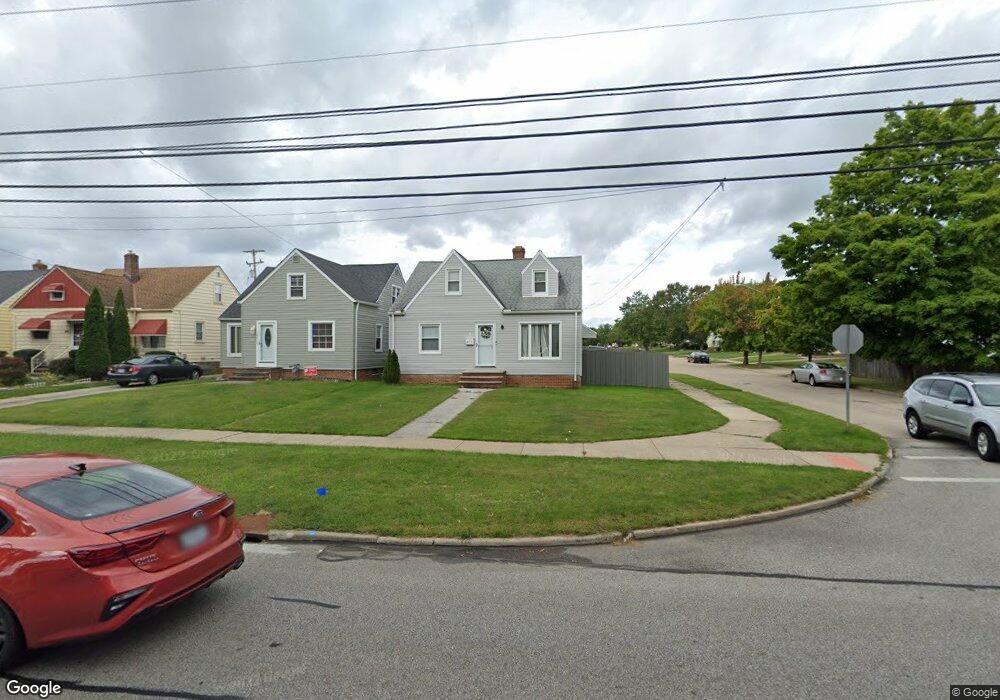
6070 W 54th St Cleveland, OH 44129
Estimated Value: $199,000 - $214,000
3
Beds
1
Bath
1,305
Sq Ft
$156/Sq Ft
Est. Value
About This Home
This home is located at 6070 W 54th St, Cleveland, OH 44129 and is currently estimated at $203,766, approximately $156 per square foot. 6070 W 54th St is a home located in Cuyahoga County with nearby schools including Renwood Elementary School, Shiloh Middle School, and Parma High School.
Ownership History
Date
Name
Owned For
Owner Type
Purchase Details
Closed on
Dec 8, 2003
Sold by
Bernstein Kenneth A and Bernstein Kristen L
Bought by
Strimpel Douglas C and Strimpel Kelly F
Current Estimated Value
Home Financials for this Owner
Home Financials are based on the most recent Mortgage that was taken out on this home.
Original Mortgage
$90,000
Outstanding Balance
$42,344
Interest Rate
6.1%
Mortgage Type
Purchase Money Mortgage
Estimated Equity
$161,422
Purchase Details
Closed on
Mar 10, 1992
Sold by
Charlillo Cynthia A
Bought by
Bernstein Kenneth A
Purchase Details
Closed on
Jul 23, 1986
Sold by
Marshall Joseph M
Bought by
Charlillo Cynthia A
Purchase Details
Closed on
Oct 28, 1977
Sold by
Milligan Jesse V and Milligan Marie B
Bought by
Marshall Joseph M
Purchase Details
Closed on
Jan 1, 1975
Bought by
Milligan Jesse and Milligan Marie B
Create a Home Valuation Report for This Property
The Home Valuation Report is an in-depth analysis detailing your home's value as well as a comparison with similar homes in the area
Home Values in the Area
Average Home Value in this Area
Purchase History
| Date | Buyer | Sale Price | Title Company |
|---|---|---|---|
| Strimpel Douglas C | $120,000 | Gateway Title Agency Inc | |
| Bernstein Kenneth A | $79,000 | -- | |
| Charlillo Cynthia A | $54,500 | -- | |
| Marshall Joseph M | $47,900 | -- | |
| Milligan Jesse | -- | -- |
Source: Public Records
Mortgage History
| Date | Status | Borrower | Loan Amount |
|---|---|---|---|
| Open | Strimpel Douglas C | $90,000 |
Source: Public Records
Tax History Compared to Growth
Tax History
| Year | Tax Paid | Tax Assessment Tax Assessment Total Assessment is a certain percentage of the fair market value that is determined by local assessors to be the total taxable value of land and additions on the property. | Land | Improvement |
|---|---|---|---|---|
| 2024 | $3,206 | $51,975 | $9,240 | $42,735 |
| 2023 | $2,965 | $41,480 | $10,190 | $31,290 |
| 2022 | $2,937 | $41,480 | $10,190 | $31,290 |
| 2021 | $3,020 | $41,480 | $10,190 | $31,290 |
| 2020 | $2,647 | $31,920 | $7,840 | $24,080 |
| 2019 | $2,533 | $91,200 | $22,400 | $68,800 |
| 2018 | $2,381 | $31,920 | $7,840 | $24,080 |
| 2017 | $2,377 | $27,660 | $6,060 | $21,600 |
| 2016 | $2,362 | $27,660 | $6,060 | $21,600 |
| 2015 | $2,250 | $27,660 | $6,060 | $21,600 |
| 2014 | $2,250 | $28,220 | $6,200 | $22,020 |
Source: Public Records
Map
Nearby Homes
- 5603 Allanwood Dr
- 6189 W 54th St
- 4802 Grantwood Dr
- 4607 Redfern Rd
- 5610 Warwick Dr
- 4702 Longwood Ave
- 6610 Renwood Dr
- 6708 Thornton Dr
- 5714 Alber Ave
- 4718 Sheraton Dr
- 6143 Wareham Dr
- 6021 Snow Rd
- 4424 Forestwood Dr
- 4302 Woodrow Ave
- 6111 Manchester Rd
- 6510 Belmere Dr
- 6818 Hampstead Ave
- 7014 Thornton Dr
- 7115 Hampstead Ave
- 6506 Snow Rd
- 6074 W 54th St
- 6078 W 54th St
- 5411 Thornton Dr
- 6062 W 54th St
- 6084 W 54th St
- 5503 Thornton Dr
- 6058 W 54th St
- 5410 Thornton Dr
- 5507 Thornton Dr
- 6088 W 54th St
- 5502 Thornton Dr
- 6054 W 54th St
- 5410 Brownfield Dr
- 5511 Thornton Dr
- 5502 Brownfield Dr
- 6092 W 54th St
- 5506 Thornton Dr
- 6050 W 54th St
- 6075 W 54th St
- 5506 Brownfield Dr