Estimated Value: $732,000 - $770,000
4
Beds
2
Baths
1,634
Sq Ft
$458/Sq Ft
Est. Value
About This Home
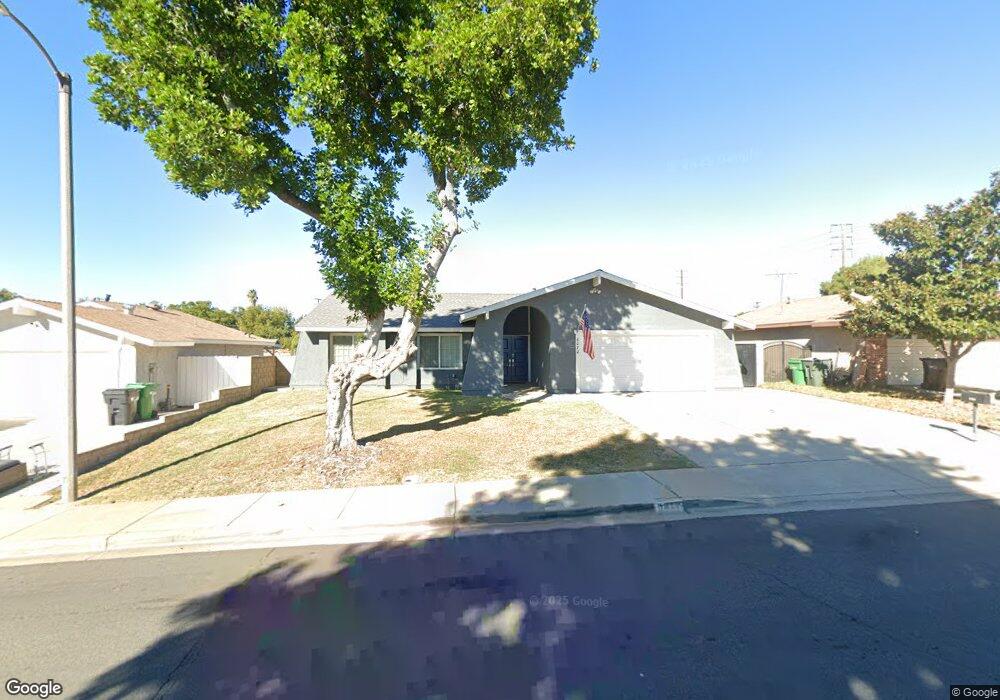
This home is located at 6072 Barbara St, Chino, CA 91710 and is currently estimated at $749,133, approximately $458 per square foot. 6072 Barbara St is a home located in San Bernardino County with nearby schools including Alicia Cortez Elementary, Magnolia Junior High, and Chino High School.
Ownership History
Date
Name
Owned For
Owner Type
Purchase Details
Closed on
Jun 10, 2025
Sold by
Munoz Gabriel
Bought by
Gabriel Munoz Living Trust and Munoz
Current Estimated Value
Purchase Details
Closed on
Oct 15, 2020
Sold by
Munoz Diane S
Bought by
Munoz Gabriel V
Home Financials for this Owner
Home Financials are based on the most recent Mortgage that was taken out on this home.
Original Mortgage
$340,110
Interest Rate
2.8%
Mortgage Type
New Conventional
Purchase Details
Closed on
Aug 16, 2000
Sold by
Faassen J Ralph Tr and Faassen Beatrice B Tr
Bought by
Munoz Gabriel V and Munoz Diane S
Home Financials for this Owner
Home Financials are based on the most recent Mortgage that was taken out on this home.
Original Mortgage
$183,600
Interest Rate
8.13%
Mortgage Type
VA
Purchase Details
Closed on
Aug 22, 1997
Sold by
Faassen Sue E
Bought by
Faassen Sue Ellen and Sue Ellen Faassen Revocable 19
Create a Home Valuation Report for This Property
The Home Valuation Report is an in-depth analysis detailing your home's value as well as a comparison with similar homes in the area
Home Values in the Area
Average Home Value in this Area
Purchase History
| Date | Buyer | Sale Price | Title Company |
|---|---|---|---|
| Gabriel Munoz Living Trust | -- | None Listed On Document | |
| Munoz Gabriel V | -- | Wfg National Title Company | |
| Munoz Gabriel V | $180,000 | First Southwestern Title Co | |
| Faassen Sue Ellen | -- | -- |
Source: Public Records
Mortgage History
| Date | Status | Borrower | Loan Amount |
|---|---|---|---|
| Previous Owner | Munoz Gabriel V | $340,110 | |
| Previous Owner | Munoz Gabriel V | $183,600 |
Source: Public Records
Tax History
| Year | Tax Paid | Tax Assessment Tax Assessment Total Assessment is a certain percentage of the fair market value that is determined by local assessors to be the total taxable value of land and additions on the property. | Land | Improvement |
|---|---|---|---|---|
| 2025 | $2,961 | $271,233 | $90,411 | $180,822 |
| 2024 | $2,881 | $265,914 | $88,638 | $177,276 |
| 2023 | $2,800 | $260,700 | $86,900 | $173,800 |
| 2022 | $2,782 | $255,588 | $85,196 | $170,392 |
| 2021 | $2,726 | $250,576 | $83,525 | $167,051 |
| 2020 | $2,691 | $248,007 | $82,669 | $165,338 |
| 2019 | $2,642 | $243,144 | $81,048 | $162,096 |
| 2018 | $2,583 | $238,377 | $79,459 | $158,918 |
| 2017 | $2,535 | $233,703 | $77,901 | $155,802 |
| 2016 | $2,368 | $229,121 | $76,374 | $152,747 |
| 2015 | $2,320 | $225,680 | $75,227 | $150,453 |
| 2014 | $2,273 | $221,259 | $73,753 | $147,506 |
Source: Public Records
Map
Nearby Homes
- 5925 Riverside Dr Unit 12
- 5963 Rosario St
- 5945 Olvera Ct
- 12644 Oaks Ave
- 12737 Carob Ct
- 12524 Ross Ave
- 13185 14th St
- 12997 Falcon Place
- 6221 Garfield St
- 13284 Cypress Ave
- 5940 Breckinridge Ln
- 12836 12th St Unit 27
- 12446 Chestnut Place
- 6157 Breckinridge Ct
- 13551 Barkley Place
- 5513 D St
- 0 C St
- 4690 Avondale Ct
- 4602 Granville Ct
- 11610 Granville Place
- 6064 Barbara St
- 6084 Barbara St
- 6052 Barbara St
- 6096 Barbara St
- 6073 Barbara St
- 6085 Barbara St
- 6048 Barbara St
- 12972 Magnolia Ave
- 6097 Barbara St
- 6045 Barbara St
- 6036 Barbara St
- 6074 Rosa Ct
- 6086 Rosa Ct
- 6062 Rosa Ct
- 12967 Magnolia Ave
- 6098 Rosa Ct
- 12957 Magnolia Ave
- 6058 Rosa Ct
- 12943 Magnolia Ave
- 6033 Barbara St
Your Personal Tour Guide
Ask me questions while you tour the home.