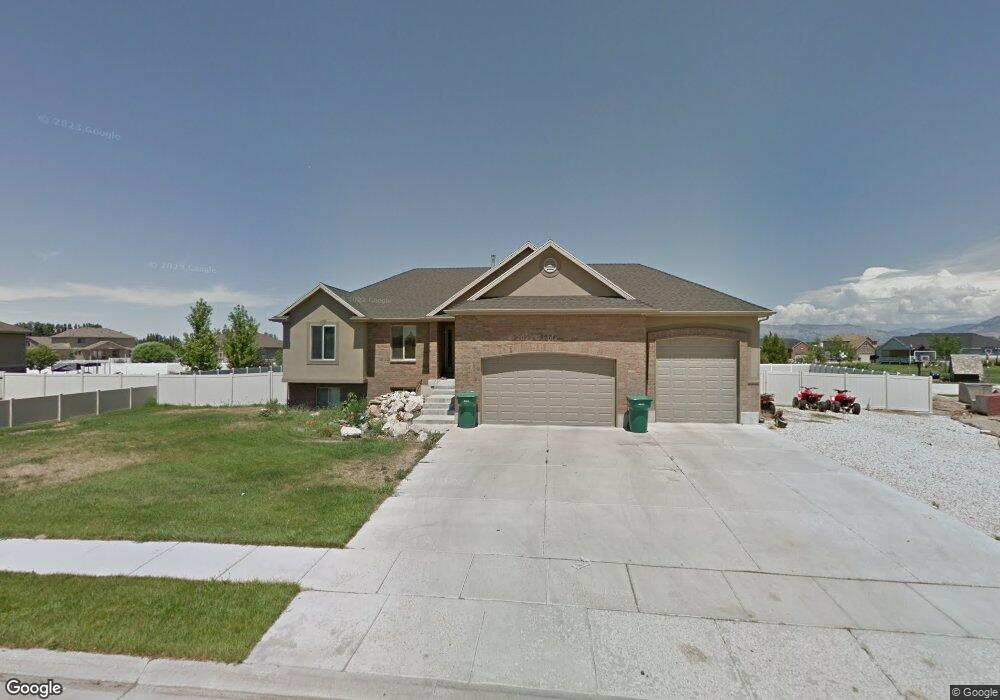
6074 W 5300 S Hooper, UT 84315
Estimated Value: $647,000 - $674,000
3
Beds
2
Baths
3,360
Sq Ft
$196/Sq Ft
Est. Value
About This Home
This home is located at 6074 W 5300 S, Hooper, UT 84315 and is currently estimated at $659,472, approximately $196 per square foot. 6074 W 5300 S is a home located in Weber County with nearby schools including Hooper Elementary School, Rocky Mountain Junior High School, and Fremont High School.
Ownership History
Date
Name
Owned For
Owner Type
Purchase Details
Closed on
Apr 4, 2007
Sold by
Wadman Homes
Bought by
Reff Andrew
Current Estimated Value
Purchase Details
Closed on
Nov 2, 2006
Sold by
W & W Properties
Bought by
Wadman Homes
Purchase Details
Closed on
Apr 20, 2006
Sold by
W & W Properties Lc
Bought by
W & W Properties Lc
Purchase Details
Closed on
Nov 15, 2005
Sold by
Lakeview Farms 1 Llc
Bought by
W & W Properties
Create a Home Valuation Report for This Property
The Home Valuation Report is an in-depth analysis detailing your home's value as well as a comparison with similar homes in the area
Home Values in the Area
Average Home Value in this Area
Purchase History
| Date | Buyer | Sale Price | Title Company |
|---|---|---|---|
| Reff Andrew | -- | Mountain View Title Ogden | |
| Wadman Homes | -- | None Available | |
| W & W Properties Lc | -- | Bonneville Superior Title Co | |
| W & W Properties | -- | Mountain View Title |
Source: Public Records
Tax History Compared to Growth
Tax History
| Year | Tax Paid | Tax Assessment Tax Assessment Total Assessment is a certain percentage of the fair market value that is determined by local assessors to be the total taxable value of land and additions on the property. | Land | Improvement |
|---|---|---|---|---|
| 2025 | $3,534 | $616,323 | $227,578 | $388,745 |
| 2024 | $3,407 | $332,749 | $125,167 | $207,582 |
| 2023 | $3,358 | $325,050 | $124,866 | $200,184 |
| 2022 | $3,094 | $306,350 | $99,760 | $206,590 |
| 2021 | $2,781 | $464,000 | $116,418 | $347,582 |
| 2020 | $2,617 | $400,000 | $101,348 | $298,652 |
| 2019 | $2,588 | $374,000 | $91,094 | $282,906 |
| 2018 | $2,481 | $343,000 | $81,015 | $261,985 |
| 2017 | $2,256 | $302,000 | $80,884 | $221,116 |
| 2016 | $2,168 | $156,723 | $38,539 | $118,184 |
| 2015 | $2,127 | $151,482 | $38,926 | $112,556 |
| 2014 | $1,987 | $137,659 | $38,926 | $98,733 |
Source: Public Records
Map
Nearby Homes
- 6014 W 5300 S
- 0 W 5500 S
- 6360 W 5500 S
- 6036 W 4700 S
- 3729 S 5600 W Unit 6
- 3720 S 5600 W Unit 2
- 3719 S 5600 W Unit 7
- 5335 W 5500 S
- 3632 S 5400 W
- 4146 S 5800 W Unit 5
- 4163 S 5800 W Unit 2
- 5319 S 7100 W
- 5752 W 2425 N
- 4879 S 5050 W
- 5801 S 7100 W
- 4111 S 5350 W
- 3191 S 5100 St W Unit 1
- 4931 S 4700 W
- 4700 W 5500 S
- 5076 S 4700 W
- 6075 W 5300 S
- 6092 W 5300 S
- 6093 W 5300 S
- 5285 S 6050 W
- 6099 W 5200 S
- 6099 W 5200 S Unit 21
- 5265 S 6050 W
- 5265 S 6050 W Unit 25
- 6099 W 5300 S Unit 21
- 6110 W 5300 S
- 6111 W 5300 S
- 6085 W 5200 S
- 6085 W 5200 S Unit 22
- 5311 S 6050 W
- 6129 W 5200 S
- 5235 S 6050 W
- 5235 S 6050 W Unit 24
- 6129 W 5300 S
- 5215 S 6050 W
- 5215 S 6050 W Unit 23