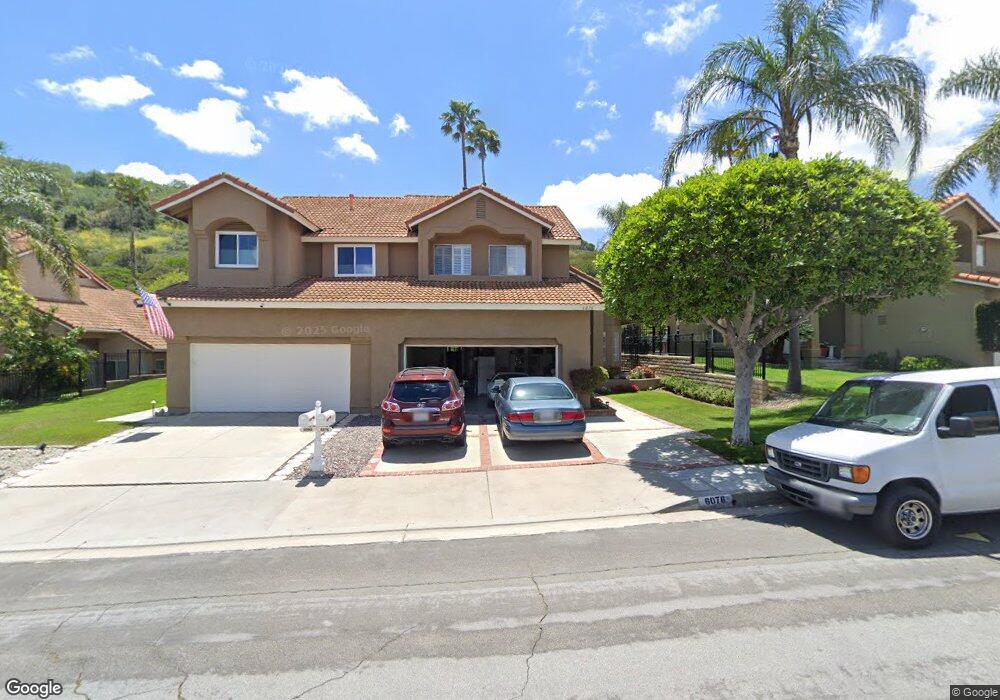
6076 E Hackamore Ln Anaheim, CA 92807
Anaheim Hills NeighborhoodEstimated Value: $908,794 - $1,004,000
3
Beds
3
Baths
1,678
Sq Ft
$573/Sq Ft
Est. Value
About This Home
This home is located at 6076 E Hackamore Ln, Anaheim, CA 92807 and is currently estimated at $961,949, approximately $573 per square foot. 6076 E Hackamore Ln is a home located in Orange County with nearby schools including Imperial Elementary School, Canyon High School, and El Rancho Charter.
Ownership History
Date
Name
Owned For
Owner Type
Purchase Details
Closed on
May 31, 2000
Sold by
Muresan Romeo S and Muresan Lavinia D
Bought by
Barone Frank S and Ploutz Barone Pamela L
Current Estimated Value
Home Financials for this Owner
Home Financials are based on the most recent Mortgage that was taken out on this home.
Original Mortgage
$183,000
Outstanding Balance
$66,580
Interest Rate
8.67%
Estimated Equity
$895,369
Purchase Details
Closed on
Mar 26, 1998
Sold by
Muresan Romeo S and Muresan Lavinia D
Bought by
Muresan Romeo S and Muresan Lavinia D
Purchase Details
Closed on
Nov 19, 1997
Sold by
Ryckman Rhonda M
Bought by
Muresan Romeo S and Muresan Lavinia D
Home Financials for this Owner
Home Financials are based on the most recent Mortgage that was taken out on this home.
Original Mortgage
$194,750
Interest Rate
7.19%
Create a Home Valuation Report for This Property
The Home Valuation Report is an in-depth analysis detailing your home's value as well as a comparison with similar homes in the area
Home Values in the Area
Average Home Value in this Area
Purchase History
| Date | Buyer | Sale Price | Title Company |
|---|---|---|---|
| Barone Frank S | $268,000 | American Title | |
| Muresan Romeo S | -- | -- | |
| Muresan Romeo S | $205,000 | Gateway Title Company |
Source: Public Records
Mortgage History
| Date | Status | Borrower | Loan Amount |
|---|---|---|---|
| Open | Barone Frank S | $183,000 | |
| Previous Owner | Muresan Romeo S | $194,750 |
Source: Public Records
Tax History
| Year | Tax Paid | Tax Assessment Tax Assessment Total Assessment is a certain percentage of the fair market value that is determined by local assessors to be the total taxable value of land and additions on the property. | Land | Improvement |
|---|---|---|---|---|
| 2025 | $4,660 | $411,899 | $203,633 | $208,266 |
| 2024 | $4,660 | $403,823 | $199,640 | $204,183 |
| 2023 | $4,556 | $395,905 | $195,725 | $200,180 |
| 2022 | $4,119 | $388,143 | $191,888 | $196,255 |
| 2021 | $4,001 | $380,533 | $188,126 | $192,407 |
| 2020 | $3,965 | $376,632 | $186,197 | $190,435 |
| 2019 | $3,912 | $369,248 | $182,547 | $186,701 |
| 2018 | $3,852 | $362,008 | $178,967 | $183,041 |
| 2017 | $3,686 | $354,910 | $175,458 | $179,452 |
| 2016 | $3,613 | $347,951 | $172,017 | $175,934 |
| 2015 | $3,567 | $342,725 | $169,433 | $173,292 |
| 2014 | $3,491 | $336,012 | $166,114 | $169,898 |
Source: Public Records
Map
Nearby Homes
- 813 S Sapphire Ln
- 6009 E Summit Ct Unit 38
- 6093 E Brighton Ln
- 818 S Amber Ln
- 2571 N Skytop Ct
- 500 S Calle de Casas
- 2440 N Highwood Rd
- 6430 E Oakview Ln
- 5810 E Mountain Loop Trail Unit 35
- 397 S San Vicente Ln Unit 31
- 6733 E San Marcos Ct
- 730 S Stillwater Ln
- 7003 E Monaco Pkwy
- 5598 E Stetson Ct Unit 22
- 381 S Henning Way
- 5901 E Firenze Crescent
- 720 S Ridgeview Rd
- 221 S Summertree Rd
- 8343 E Chatham Terrace
- 5447 E Willowick Cir
- 6080 E Hackamore Ln
- 6072 E Hackamore Ln
- 6084 E Hackamore Ln
- 6068 E Hackamore Ln
- 6088 E Hackamore Ln
- 6064 E Hackamore Ln
- 6060 E Hackamore Ln
- 6089 E Hackamore Ln
- 6085 E Hackamore Ln
- 6090 E Hackamore Ln
- 6093 E Hackamore Ln
- 6081 E Hackamore Ln
- 6097 E Hackamore Ln
- 6075 E Hackamore Ln
- 6056 E Hackamore Ln
- 6073 E Hackamore Ln
- 6092 E Hackamore Ln
- 6069 E Hackamore Ln
- 6065 E Hackamore Ln
- 6099 E Hackamore Ln
Your Personal Tour Guide
Ask me questions while you tour the home.