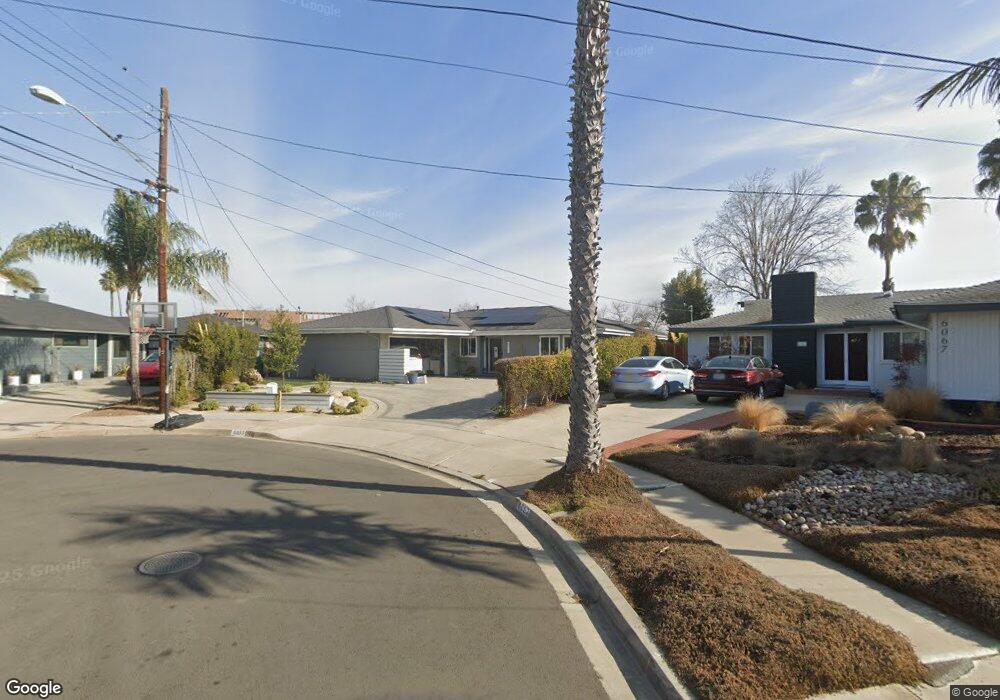
6077 Carnegie St San Diego, CA 92122
University City NeighborhoodEstimated Value: $1,690,000 - $1,879,054
4
Beds
2
Baths
1,906
Sq Ft
$952/Sq Ft
Est. Value
About This Home
This home is located at 6077 Carnegie St, San Diego, CA 92122 and is currently estimated at $1,814,764, approximately $952 per square foot. 6077 Carnegie St is a home located in San Diego County with nearby schools including Spreckels Elementary School, Standley Middle School, and University City High School.
Ownership History
Date
Name
Owned For
Owner Type
Purchase Details
Closed on
Aug 19, 2016
Sold by
Forde Daniel R and Forde Blair W
Bought by
Forde Daniel R and Forde Blair W
Current Estimated Value
Purchase Details
Closed on
Jun 3, 2016
Sold by
Tjrf Associates Llc
Bought by
Forde Daniel R and Forde Blair W
Home Financials for this Owner
Home Financials are based on the most recent Mortgage that was taken out on this home.
Original Mortgage
$580,000
Outstanding Balance
$462,216
Interest Rate
3.61%
Mortgage Type
New Conventional
Estimated Equity
$1,352,548
Purchase Details
Closed on
Mar 30, 2016
Sold by
Quinney Carolyn Douglas
Bought by
Tjrf Associates Llc
Purchase Details
Closed on
Aug 2, 2002
Sold by
Carolyn S Douglas Family Trust
Bought by
Quinney Carolyn Douglas
Purchase Details
Closed on
Aug 10, 1996
Sold by
Douglas Carolyn S
Bought by
Douglas Carolyn S
Create a Home Valuation Report for This Property
The Home Valuation Report is an in-depth analysis detailing your home's value as well as a comparison with similar homes in the area
Home Values in the Area
Average Home Value in this Area
Purchase History
| Date | Buyer | Sale Price | Title Company |
|---|---|---|---|
| Forde Daniel R | -- | None Available | |
| Forde Daniel R | $880,000 | Equity Title Company | |
| Tjrf Associates Llc | $685,000 | Equity Title San Diego | |
| Quinney Carolyn Douglas | -- | -- | |
| Douglas Carolyn S | -- | -- |
Source: Public Records
Mortgage History
| Date | Status | Borrower | Loan Amount |
|---|---|---|---|
| Open | Forde Daniel R | $580,000 |
Source: Public Records
Tax History Compared to Growth
Tax History
| Year | Tax Paid | Tax Assessment Tax Assessment Total Assessment is a certain percentage of the fair market value that is determined by local assessors to be the total taxable value of land and additions on the property. | Land | Improvement |
|---|---|---|---|---|
| 2025 | $14,829 | $1,235,911 | $762,916 | $472,995 |
| 2024 | $14,829 | $1,211,678 | $747,957 | $463,721 |
| 2023 | $14,501 | $1,054,825 | $712,051 | $342,774 |
| 2022 | $12,778 | $1,054,825 | $712,051 | $342,774 |
| 2021 | $12,689 | $1,034,143 | $698,090 | $336,053 |
| 2020 | $12,534 | $1,023,540 | $690,932 | $332,608 |
| 2019 | $11,452 | $933,863 | $668,561 | $265,302 |
| 2018 | $10,704 | $915,552 | $655,452 | $260,100 |
| 2017 | $10,449 | $897,600 | $642,600 | $255,000 |
| 2016 | $1,423 | $118,671 | $32,763 | $85,908 |
| 2015 | $1,402 | $116,889 | $32,271 | $84,618 |
| 2014 | $1,382 | $114,600 | $31,639 | $82,961 |
Source: Public Records
Map
Nearby Homes
- 6036 Tulane St
- 3426 Millikin Ave
- 3003 Fried Ave
- 3542 Governor Dr
- 5822 Stadium St
- 2925 Fried Ave
- 6174 Syracuse Way
- 6614 Dennison St
- 3598 Syracuse Ave
- 3941 Camino Lindo
- 6547 Radcliffe Dr
- 7849 Camino Glorita
- 3965 Camino Lindo Unit 194
- 6330 Genesee Ave Unit 220
- 6330 Genesee Ave Unit 112
- 6330 Genesee Ave Unit 213
- 6330 Genesee Ave Unit 103
- 7825 Camino Tranquilo Unit 26
- 7837 Camino Tranquilo
- 7833 Camino Huerta
- 6067 Carnegie St
- 6076 Carnegie St
- 6704 Scripps St
- 6098 Scripps St
- 6086 Scripps St
- 6061 Carnegie St
- 6074 Scripps St
- 3201 Governor Dr
- 3203 Governor Dr
- 3215 Governor Dr
- 3203 Governor Dr
- 3209 Governor Dr
- 3211 Governor Dr Unit L6
- 3207 Governor Dr Unit L4
- 3205 Governor Dr Unit L3
- 3213 Governor Dr Unit L7
- 6062 Scripps St
- 6053 Carnegie St
- 6064 Carnegie St
- 6050 Scripps St