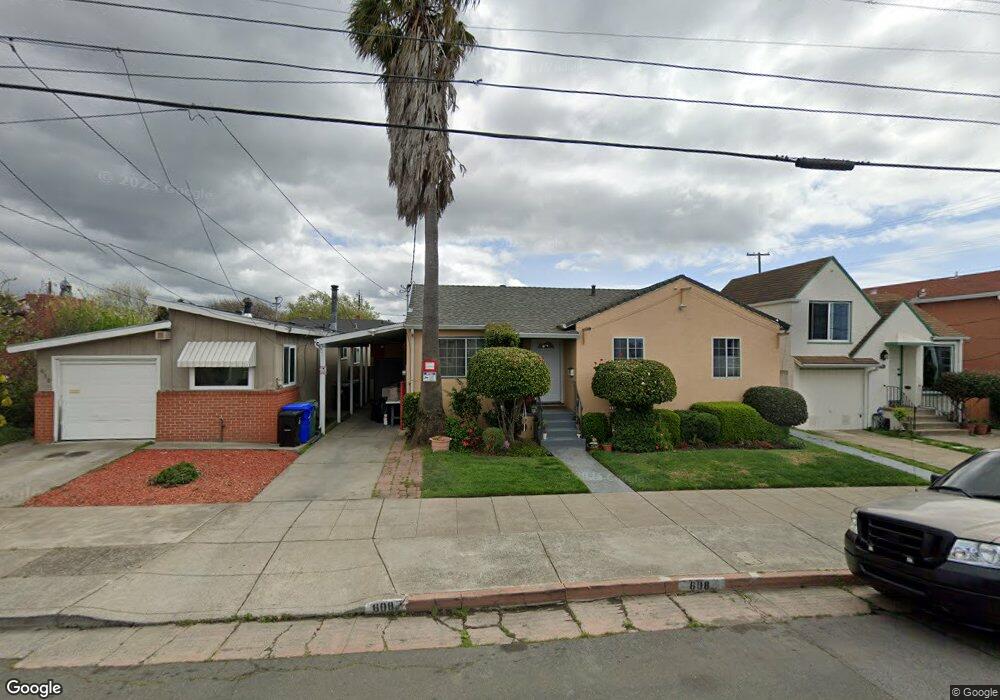
608 24th St Richmond, CA 94804
North & East NeighborhoodEstimated Value: $616,000 - $734,000
3
Beds
2
Baths
1,668
Sq Ft
$405/Sq Ft
Est. Value
About This Home
This home is located at 608 24th St, Richmond, CA 94804 and is currently estimated at $674,720, approximately $404 per square foot. 608 24th St is a home located in Contra Costa County with nearby schools including Michelle Obama School, Lovonya DeJean Middle School, and John F. Kennedy High School.
Ownership History
Date
Name
Owned For
Owner Type
Purchase Details
Closed on
Apr 16, 2018
Sold by
Perez Francisco H
Bought by
Moore Cameron M and Reckler Leslie R
Current Estimated Value
Home Financials for this Owner
Home Financials are based on the most recent Mortgage that was taken out on this home.
Original Mortgage
$337,500
Outstanding Balance
$290,379
Interest Rate
4.46%
Mortgage Type
New Conventional
Estimated Equity
$384,341
Purchase Details
Closed on
Oct 27, 2011
Sold by
Federal Home Loan Mortgage Corporation
Bought by
Perez Francisco H
Home Financials for this Owner
Home Financials are based on the most recent Mortgage that was taken out on this home.
Original Mortgage
$194,930
Interest Rate
3.94%
Mortgage Type
FHA
Purchase Details
Closed on
May 31, 2011
Sold by
Akinmusire Ambrose O and Akinmusire Marcia A
Bought by
Federal Home Loan Mortgage Corporation
Purchase Details
Closed on
Nov 14, 2006
Sold by
Akinmusire Ambrose O
Bought by
Akinmusire Ambrose O and Akinmusire Marcia A
Purchase Details
Closed on
Oct 18, 2006
Sold by
Akinmusire Marcia A
Bought by
Akinmusire Ambrose O
Purchase Details
Closed on
Aug 25, 2000
Sold by
Ragland Paul E and Ragland Fayrene
Bought by
Akinmusire Ambrose O and Akinmusire Marcia A
Home Financials for this Owner
Home Financials are based on the most recent Mortgage that was taken out on this home.
Original Mortgage
$166,667
Interest Rate
8.11%
Mortgage Type
Purchase Money Mortgage
Purchase Details
Closed on
Feb 6, 1997
Sold by
Ragland Paul E & Fayrene Tre
Bought by
Ragland Paul E and Ragland Fayrene
Home Financials for this Owner
Home Financials are based on the most recent Mortgage that was taken out on this home.
Original Mortgage
$108,750
Interest Rate
8.75%
Mortgage Type
Purchase Money Mortgage
Purchase Details
Closed on
Mar 10, 1995
Sold by
Ragland Paul E and Ragland Fayrene
Bought by
Ragland Paul E and Ragland Fayrene
Create a Home Valuation Report for This Property
The Home Valuation Report is an in-depth analysis detailing your home's value as well as a comparison with similar homes in the area
Home Values in the Area
Average Home Value in this Area
Purchase History
| Date | Buyer | Sale Price | Title Company |
|---|---|---|---|
| Moore Cameron M | $450,000 | Old Republic Title Company | |
| Perez Francisco H | $200,000 | Lsi Title Company | |
| Federal Home Loan Mortgage Corporation | $140,034 | Lps Default Title & Closing | |
| Akinmusire Ambrose O | -- | Chicago Title Co | |
| Akinmusire Ambrose O | -- | Chicago Title Co | |
| Akinmusire Ambrose O | $171,000 | First American Title Guarant | |
| Ragland Paul E | -- | Nortwestern Title Company | |
| Ragland Paul E | -- | -- |
Source: Public Records
Mortgage History
| Date | Status | Borrower | Loan Amount |
|---|---|---|---|
| Open | Moore Cameron M | $337,500 | |
| Previous Owner | Perez Francisco H | $194,930 | |
| Previous Owner | Akinmusire Ambrose O | $166,667 | |
| Previous Owner | Ragland Paul E | $108,750 |
Source: Public Records
Tax History
| Year | Tax Paid | Tax Assessment Tax Assessment Total Assessment is a certain percentage of the fair market value that is determined by local assessors to be the total taxable value of land and additions on the property. | Land | Improvement |
|---|---|---|---|---|
| 2025 | $9,315 | $546,154 | $341,347 | $204,807 |
| 2024 | $8,990 | $535,446 | $334,654 | $200,792 |
| 2023 | $8,990 | $524,948 | $328,093 | $196,855 |
| 2022 | $8,835 | $514,656 | $321,660 | $192,996 |
| 2021 | $8,758 | $504,565 | $315,353 | $189,212 |
| 2019 | $8,238 | $489,600 | $306,000 | $183,600 |
| 2018 | $4,328 | $220,776 | $137,985 | $82,791 |
| 2017 | $4,219 | $216,448 | $135,280 | $81,168 |
| 2016 | $4,146 | $212,205 | $132,628 | $79,577 |
| 2015 | $4,108 | $209,018 | $130,636 | $78,382 |
| 2014 | $4,071 | $204,925 | $128,078 | $76,847 |
Source: Public Records
Map
Nearby Homes
Your Personal Tour Guide
Ask me questions while you tour the home.