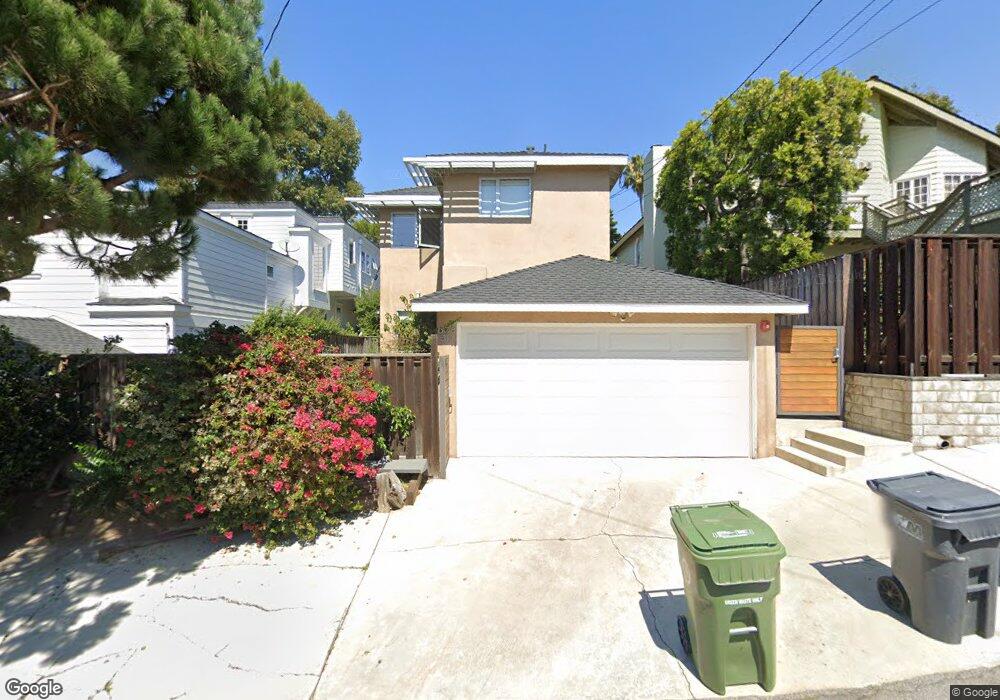
608 31st St Manhattan Beach, CA 90266
Estimated Value: $3,112,160 - $4,348,000
4
Beds
2
Baths
2,330
Sq Ft
$1,503/Sq Ft
Est. Value
About This Home
This home is located at 608 31st St, Manhattan Beach, CA 90266 and is currently estimated at $3,501,790, approximately $1,502 per square foot. 608 31st St is a home located in Los Angeles County with nearby schools including Grand View Elementary School, Manhattan Beach Middle School, and Mira Costa High School.
Ownership History
Date
Name
Owned For
Owner Type
Purchase Details
Closed on
Jun 23, 2016
Sold by
Grzesek Robert and Wong Lee Ann
Bought by
Grzesek Robert J and Wong Lee Ann
Current Estimated Value
Purchase Details
Closed on
Apr 21, 2011
Sold by
Weaver Carolyn and The Peggy G Wyss 1995 Trust
Bought by
Grzesek Robert and Wong Lee Ann
Home Financials for this Owner
Home Financials are based on the most recent Mortgage that was taken out on this home.
Original Mortgage
$920,000
Outstanding Balance
$621,806
Interest Rate
4.37%
Mortgage Type
New Conventional
Estimated Equity
$2,879,984
Purchase Details
Closed on
Feb 23, 2007
Sold by
Weaver Carolyn and De La Garrigue Dianne
Bought by
Weaver Carolyn and Peggy G Wyss 1995 Trust
Purchase Details
Closed on
Oct 17, 2005
Sold by
Weaver Carolyn and Peggy G Wyss 1995 Trust
Bought by
Weaver Carolyn and Delagarrigue Dianne
Purchase Details
Closed on
Jun 15, 1995
Sold by
Wyss Peggy G and Delagarrigue Peggy Gelene
Bought by
Wyss Peggy G and Peggy G Wyss Trust
Create a Home Valuation Report for This Property
The Home Valuation Report is an in-depth analysis detailing your home's value as well as a comparison with similar homes in the area
Home Values in the Area
Average Home Value in this Area
Purchase History
| Date | Buyer | Sale Price | Title Company |
|---|---|---|---|
| Grzesek Robert J | -- | None Available | |
| Grzesek Robert | $1,210,000 | Usa National Title Company | |
| Weaver Carolyn | -- | None Available | |
| Weaver Carolyn | -- | -- | |
| Wyss Peggy G | -- | -- |
Source: Public Records
Mortgage History
| Date | Status | Borrower | Loan Amount |
|---|---|---|---|
| Open | Grzesek Robert | $920,000 |
Source: Public Records
Tax History Compared to Growth
Tax History
| Year | Tax Paid | Tax Assessment Tax Assessment Total Assessment is a certain percentage of the fair market value that is determined by local assessors to be the total taxable value of land and additions on the property. | Land | Improvement |
|---|---|---|---|---|
| 2025 | $18,099 | $1,580,617 | $1,240,176 | $340,441 |
| 2024 | $18,099 | $1,549,625 | $1,215,859 | $333,766 |
| 2023 | $17,582 | $1,519,241 | $1,192,019 | $327,222 |
| 2022 | $17,333 | $1,489,453 | $1,168,647 | $320,806 |
| 2021 | $17,002 | $1,460,249 | $1,145,733 | $314,516 |
| 2019 | $16,552 | $1,416,939 | $1,111,750 | $305,189 |
| 2018 | $16,197 | $1,389,156 | $1,089,951 | $299,205 |
| 2016 | $15,004 | $1,335,216 | $1,047,628 | $287,588 |
| 2015 | $14,696 | $1,315,161 | $1,031,892 | $283,269 |
| 2014 | $14,494 | $1,289,400 | $1,011,679 | $277,721 |
Source: Public Records
Map
Nearby Homes