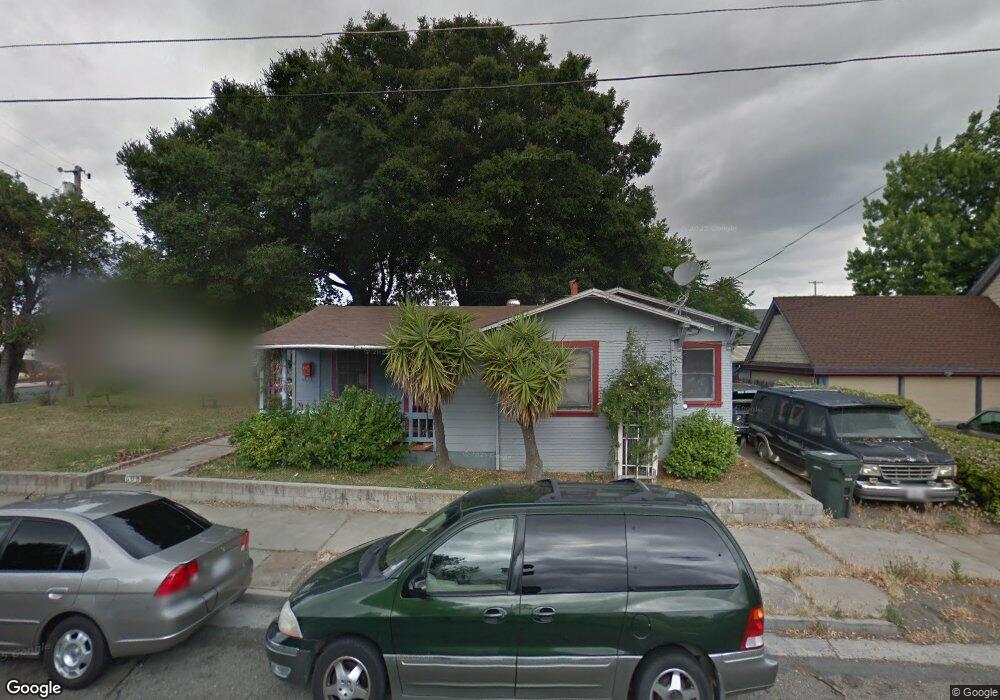
608 B St Antioch, CA 94509
North Antioch NeighborhoodEstimated Value: $404,000 - $408,411
2
Beds
1
Bath
898
Sq Ft
$453/Sq Ft
Est. Value
About This Home
This home is located at 608 B St, Antioch, CA 94509 and is currently estimated at $406,470, approximately $452 per square foot. 608 B St is a home located in Contra Costa County with nearby schools including Fremont Elementary School, Antioch Middle School, and Antioch High School.
Ownership History
Date
Name
Owned For
Owner Type
Purchase Details
Closed on
Jan 8, 2019
Sold by
Stokley Properties Llc
Bought by
Stokley Properties Llc
Current Estimated Value
Purchase Details
Closed on
Jun 28, 2017
Sold by
Stokley Joseph F and Stokley Sheila L
Bought by
Stokley Properties Llc B Street Ltd
Purchase Details
Closed on
Apr 10, 2017
Sold by
Community Fund Llc
Bought by
Stokley Joseph F and Patricia Ann Stokley A
Purchase Details
Closed on
Mar 2, 2016
Sold by
Young Arthur and Young Gayle M
Bought by
Community Fund Llc
Create a Home Valuation Report for This Property
The Home Valuation Report is an in-depth analysis detailing your home's value as well as a comparison with similar homes in the area
Home Values in the Area
Average Home Value in this Area
Purchase History
| Date | Buyer | Sale Price | Title Company |
|---|---|---|---|
| Stokley Properties Llc | -- | Ticor Title Company Of Ca | |
| Stokley Properties Llc B Street Ltd | -- | None Available | |
| Stokley Joseph F | $280,000 | First American Title Company | |
| Community Fund Llc | $136,100 | None Available |
Source: Public Records
Tax History
| Year | Tax Paid | Tax Assessment Tax Assessment Total Assessment is a certain percentage of the fair market value that is determined by local assessors to be the total taxable value of land and additions on the property. | Land | Improvement |
|---|---|---|---|---|
| 2025 | $5,641 | $452,301 | $271,225 | $181,076 |
| 2024 | $5,366 | $443,433 | $265,907 | $177,526 |
| 2023 | $5,366 | $434,740 | $260,694 | $174,046 |
| 2022 | $5,282 | $426,217 | $255,583 | $170,634 |
| 2021 | $3,775 | $300,214 | $250,572 | $49,642 |
| 2019 | $3,727 | $291,311 | $243,141 | $48,170 |
| 2018 | $3,597 | $285,600 | $238,374 | $47,226 |
| 2017 | $1,944 | $138,822 | $122,400 | $16,422 |
| 2016 | $4,153 | $138,292 | $59,043 | $79,249 |
| 2015 | $1,806 | $136,216 | $58,157 | $78,059 |
| 2014 | $1,490 | $110,500 | $47,178 | $63,322 |
Source: Public Records
Map
Nearby Homes
Your Personal Tour Guide
Ask me questions while you tour the home.