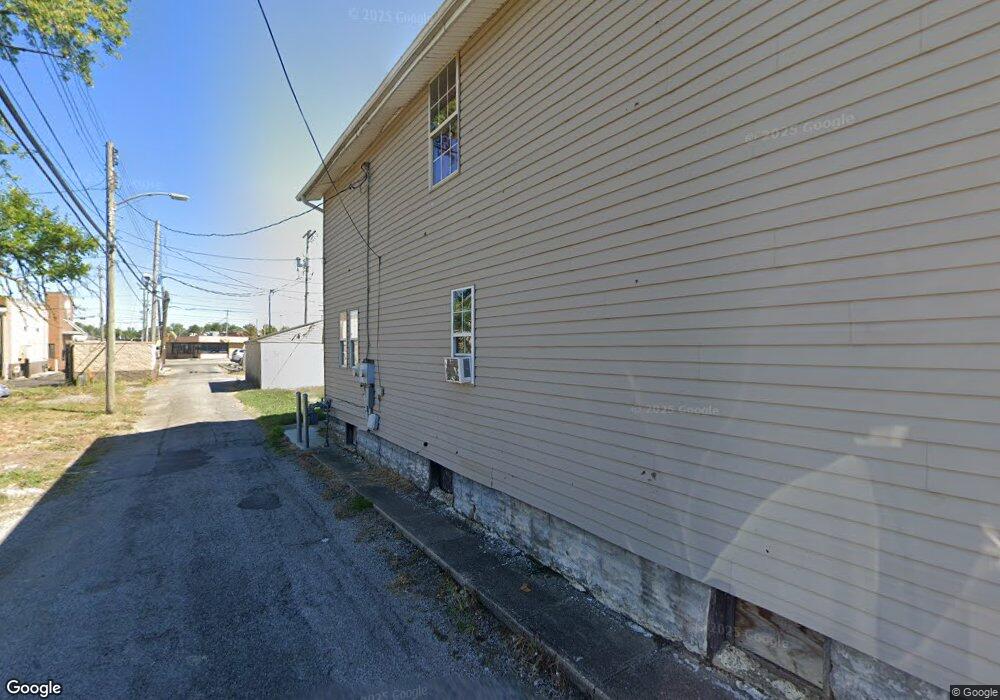
608 E 4th Ave Unit 610 Columbus, OH 43201
Milo-Grogan NeighborhoodEstimated Value: $230,000 - $277,000
3
Beds
1
Bath
1,200
Sq Ft
$205/Sq Ft
Est. Value
About This Home
This home is located at 608 E 4th Ave Unit 610, Columbus, OH 43201 and is currently estimated at $246,333, approximately $205 per square foot. 608 E 4th Ave Unit 610 is a home located in Franklin County with nearby schools including Weinland Park Elementary School, Dominion Middle School, and Whetstone High School.
Ownership History
Date
Name
Owned For
Owner Type
Purchase Details
Closed on
Dec 29, 2017
Sold by
Bird Terry and Bird Jauna R
Bought by
Eckert Joseph P
Current Estimated Value
Purchase Details
Closed on
Jan 5, 2004
Sold by
Vanleer Sylvia and Vanleer William E
Bought by
Bird Terry and Bird Jauna R
Home Financials for this Owner
Home Financials are based on the most recent Mortgage that was taken out on this home.
Original Mortgage
$56,250
Interest Rate
6.3%
Mortgage Type
Purchase Money Mortgage
Purchase Details
Closed on
Feb 2, 2001
Sold by
Green Donald F
Bought by
Vanleer Sylvia
Home Financials for this Owner
Home Financials are based on the most recent Mortgage that was taken out on this home.
Original Mortgage
$60,832
Interest Rate
7.18%
Purchase Details
Closed on
Jan 9, 1997
Sold by
Parks Virginia L
Bought by
Donald F Green
Purchase Details
Closed on
Feb 17, 1993
Create a Home Valuation Report for This Property
The Home Valuation Report is an in-depth analysis detailing your home's value as well as a comparison with similar homes in the area
Home Values in the Area
Average Home Value in this Area
Purchase History
| Date | Buyer | Sale Price | Title Company |
|---|---|---|---|
| Eckert Joseph P | $40,700 | None Available | |
| Bird Terry | $62,500 | Chicago Title | |
| Vanleer Sylvia | $71,000 | Title First Agency Inc | |
| Donald F Green | $9,000 | -- | |
| -- | -- | -- |
Source: Public Records
Mortgage History
| Date | Status | Borrower | Loan Amount |
|---|---|---|---|
| Previous Owner | Bird Terry | $56,250 | |
| Previous Owner | Vanleer Sylvia | $60,832 |
Source: Public Records
Tax History
| Year | Tax Paid | Tax Assessment Tax Assessment Total Assessment is a certain percentage of the fair market value that is determined by local assessors to be the total taxable value of land and additions on the property. | Land | Improvement |
|---|---|---|---|---|
| 2025 | $2,995 | $43,750 | $22,680 | $21,070 |
| 2024 | $2,995 | $43,750 | $22,680 | $21,070 |
| 2023 | $1,980 | $43,750 | $22,680 | $21,070 |
| 2022 | $870 | $16,380 | $3,920 | $12,460 |
| 2021 | $872 | $16,380 | $3,920 | $12,460 |
| 2020 | $873 | $16,380 | $3,920 | $12,460 |
| 2019 | $886 | $14,250 | $3,400 | $10,850 |
| 2018 | $1,156 | $14,250 | $3,400 | $10,850 |
| 2017 | $1,935 | $37,040 | $3,400 | $33,640 |
| 2016 | $1,567 | $23,070 | $2,700 | $20,370 |
| 2015 | $1,427 | $23,070 | $2,700 | $20,370 |
| 2014 | $1,430 | $23,070 | $2,700 | $20,370 |
| 2013 | $743 | $24,290 | $2,835 | $21,455 |
Source: Public Records
Map
Nearby Homes
- 276 E 4th Ave
- 1000 N 9th St
- 1025 Howard St
- 796 E 4th Ave
- 1195 Sidney St Unit 197
- 780-782 Gibbard Ave
- 633 E Starr Ave
- 773-775 E 3rd Ave
- 1222 N Grant Ave Unit H
- 1187 Cromartie Ln
- 663 E 2nd Ave
- 606 Reynolds Ave
- 997-999 Gibbard Ave
- 472 Reynolds Ave Unit 474
- 1190 N Grant Ave Unit A
- 1239 Cromartie Ln
- 1141 Peters Ave
- 765 E 2nd Ave
- 288 E 4th Ave
- 295 E 5th Ave
- 614 E 4th Ave
- 618 E 4th Ave Unit 618
- 622 E 4th Ave
- 163 E 4th Ave
- 1064 Cleveland Ave Unit 6
- 624 E 4th Ave
- 630 E 4th Ave
- 1042 Cleveland Ave
- 613 E 4th Ave
- 1036 Cleveland Ave Unit 42
- 601 E 4th Ave
- 599 E 4th Ave
- 1036 Cleveland Ave
- 603 E 4th Ave
- 1038 Cleveland Ave
- 1036-1042 Cleveland Ave
- 783 E 4th Ave
- 636 E 4th Ave
- 1068 Cleveland Ave
- 1080 Cleveland Ave
Your Personal Tour Guide
Ask me questions while you tour the home.