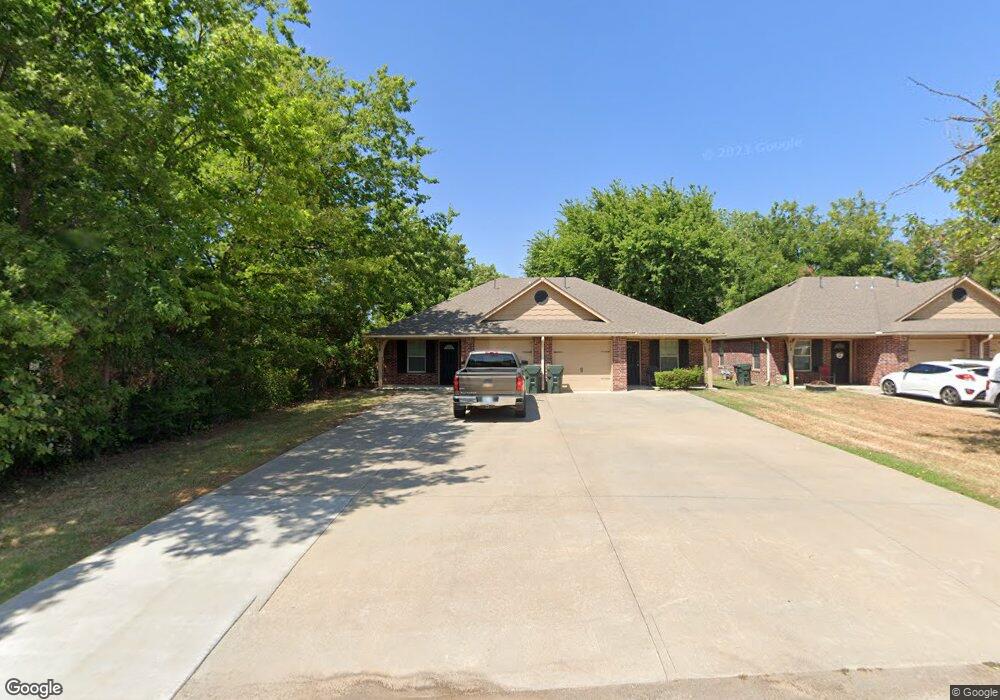
608 E 6th St Claremore, OK 74017
Estimated Value: $230,000 - $290,000
4
Beds
2
Baths
1,954
Sq Ft
$130/Sq Ft
Est. Value
About This Home
This home is located at 608 E 6th St, Claremore, OK 74017 and is currently estimated at $254,925, approximately $130 per square foot. 608 E 6th St is a home with nearby schools including Claremont Elementary School, Will Rogers Junior High School, and Claremore High School.
Ownership History
Date
Name
Owned For
Owner Type
Purchase Details
Closed on
Sep 19, 2023
Sold by
Dake Properties Inc
Bought by
Dake Properties Inc
Current Estimated Value
Purchase Details
Closed on
Aug 19, 2023
Sold by
Dake Properties Inc
Bought by
City Of Claremore
Purchase Details
Closed on
Jun 9, 2023
Sold by
Beil Laura E and Beil Bobbie R
Bought by
Dake Properties Inc
Purchase Details
Closed on
Nov 1, 2022
Sold by
Dake Properties Inc
Bought by
Dake Properties Inc
Purchase Details
Closed on
Aug 16, 2021
Sold by
Dake Properties Inc
Bought by
Dake Harold Brent
Purchase Details
Closed on
Jun 1, 2017
Sold by
Claremore Property Developers
Bought by
Dake Harlod
Purchase Details
Closed on
May 31, 2017
Sold by
Claremore Property Developers
Bought by
Dake Harlod
Purchase Details
Closed on
Jul 8, 2008
Sold by
Federal Home Loan Mortgage Corporation
Bought by
Intrinsic Properties Inc
Create a Home Valuation Report for This Property
The Home Valuation Report is an in-depth analysis detailing your home's value as well as a comparison with similar homes in the area
Home Values in the Area
Average Home Value in this Area
Purchase History
| Date | Buyer | Sale Price | Title Company |
|---|---|---|---|
| Dake Properties Inc | -- | None Listed On Document | |
| City Of Claremore | -- | None Listed On Document | |
| Dake Properties Inc | -- | None Listed On Document | |
| City Of Claremore | -- | None Listed On Document | |
| Dake Properties Inc | $15,000 | None Listed On Document | |
| Dake Properties Inc | -- | -- | |
| Dake Harold Brent | -- | None Available | |
| Dake Harlod | -- | None Available | |
| Dake Harold | -- | None Available | |
| Dake Harlod | -- | None Available | |
| Dake Harold | -- | None Available | |
| Intrinsic Properties Inc | -- | None Available |
Source: Public Records
Tax History
| Year | Tax Paid | Tax Assessment Tax Assessment Total Assessment is a certain percentage of the fair market value that is determined by local assessors to be the total taxable value of land and additions on the property. | Land | Improvement |
|---|---|---|---|---|
| 2025 | $2,203 | $23,830 | $3,252 | $20,578 |
| 2024 | $2,098 | $22,696 | $2,879 | $19,817 |
| 2023 | $2,098 | $21,615 | $2,462 | $19,153 |
| 2022 | $1,950 | $21,066 | $2,462 | $18,604 |
| 2021 | $1,771 | $20,062 | $2,462 | $17,600 |
| 2020 | $1,763 | $19,250 | $1,979 | $17,271 |
| 2019 | $1,722 | $18,597 | $1,979 | $16,618 |
| 2018 | $1,782 | $19,286 | $1,979 | $17,307 |
| 2017 | $1,756 | $19,120 | $1,979 | $17,141 |
| 2016 | $1,713 | $18,255 | $1,979 | $16,276 |
| 2015 | $1,639 | $17,674 | $1,979 | $15,695 |
| 2014 | $1,621 | $17,483 | $1,979 | $15,504 |
Source: Public Records
Map
Nearby Homes
- 614 E 5th St
- 212 N Lavira Ave
- 221 N Dorothy Ave
- 411 E 6th St
- 402 E 6th St
- 430 E Will Rogers Blvd
- 321 E 4th St
- 402 E Patti Page Blvd
- 704 N Sioux Ave
- 403 N Choctaw Ave
- 607 E 11th St
- 601 E 11th St
- 321 E Patti Page Blvd
- 817 E 11th St
- 821 E 11th St
- 104 W 7th St
- 1114 N Osage Ave
- 2925 E Holly Rd
- 1137 N Oklahoma Ave
- 620 S Choctaw Ave
Your Personal Tour Guide
Ask me questions while you tour the home.