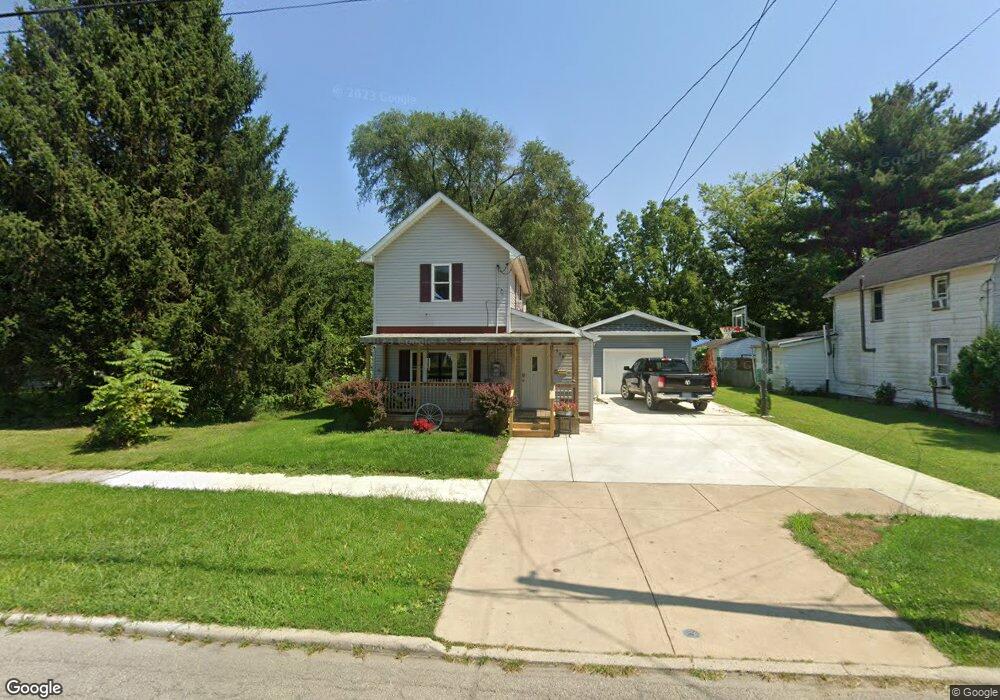
608 Lee St Marion, OH 43302
Estimated Value: $86,319 - $113,000
2
Beds
1
Bath
1,220
Sq Ft
$77/Sq Ft
Est. Value
About This Home
This home is located at 608 Lee St, Marion, OH 43302 and is currently estimated at $94,330, approximately $77 per square foot. 608 Lee St is a home located in Marion County with nearby schools including Rutherford B. Hayes Elementary School, Ulysses S. Grant Middle School, and Harding High School.
Ownership History
Date
Name
Owned For
Owner Type
Purchase Details
Closed on
Jun 7, 2013
Sold by
Higgins Ben A and Higgins Tracy A
Bought by
Russell Chelsey C
Current Estimated Value
Home Financials for this Owner
Home Financials are based on the most recent Mortgage that was taken out on this home.
Original Mortgage
$36,427
Outstanding Balance
$25,924
Interest Rate
3.5%
Mortgage Type
FHA
Estimated Equity
$68,406
Purchase Details
Closed on
Aug 23, 2005
Sold by
Homeconigs Financial Network Inc
Bought by
Hackworth James T and Hackworth June C
Purchase Details
Closed on
Oct 6, 2003
Sold by
Stark Shawn A
Bought by
Lpi Liquidation Properties Inc
Create a Home Valuation Report for This Property
The Home Valuation Report is an in-depth analysis detailing your home's value as well as a comparison with similar homes in the area
Home Values in the Area
Average Home Value in this Area
Purchase History
| Date | Buyer | Sale Price | Title Company |
|---|---|---|---|
| Russell Chelsey C | $37,100 | None Available | |
| Hackworth James T | $17,500 | Craig Rels Title | |
| Homecomings Financial Network Inc | -- | Craig Rels Title | |
| Lpi Liquidation Properties Inc | $23,334 | None Available |
Source: Public Records
Mortgage History
| Date | Status | Borrower | Loan Amount |
|---|---|---|---|
| Open | Russell Chelsey C | $36,427 |
Source: Public Records
Tax History Compared to Growth
Tax History
| Year | Tax Paid | Tax Assessment Tax Assessment Total Assessment is a certain percentage of the fair market value that is determined by local assessors to be the total taxable value of land and additions on the property. | Land | Improvement |
|---|---|---|---|---|
| 2024 | $930 | $20,090 | $1,490 | $18,600 |
| 2023 | $930 | $20,090 | $1,490 | $18,600 |
| 2022 | $604 | $14,790 | $1,490 | $13,300 |
| 2021 | $447 | $11,540 | $1,300 | $10,240 |
| 2020 | $447 | $11,540 | $1,300 | $10,240 |
| 2019 | $439 | $11,350 | $1,300 | $10,050 |
| 2018 | $473 | $12,250 | $1,280 | $10,970 |
| 2017 | $764 | $12,250 | $1,280 | $10,970 |
| 2016 | $476 | $12,250 | $1,280 | $10,970 |
| 2015 | $475 | $11,980 | $1,220 | $10,760 |
| 2014 | $495 | $11,980 | $1,220 | $10,760 |
| 2012 | $539 | $13,100 | $1,280 | $11,820 |
Source: Public Records
Map
Nearby Homes
- 523 Thompson St
- 531 Toledo Ave
- 641 Blake Ave
- 520 Toledo Ave
- 485 Avondale Ave
- 355 Lee St
- 468 Avondale Ave
- 551 Universal Ave Unit 555
- 134 Waterloo St
- 636 Mary St
- 343 Commercial St
- 178 Leader St
- 213 Sharp St
- 347 Mary St
- 233 Tully St
- 552 N Prospect St
- 736 N Main St
- 395 N Main St
- 593 N State St
- 1015 N Main St