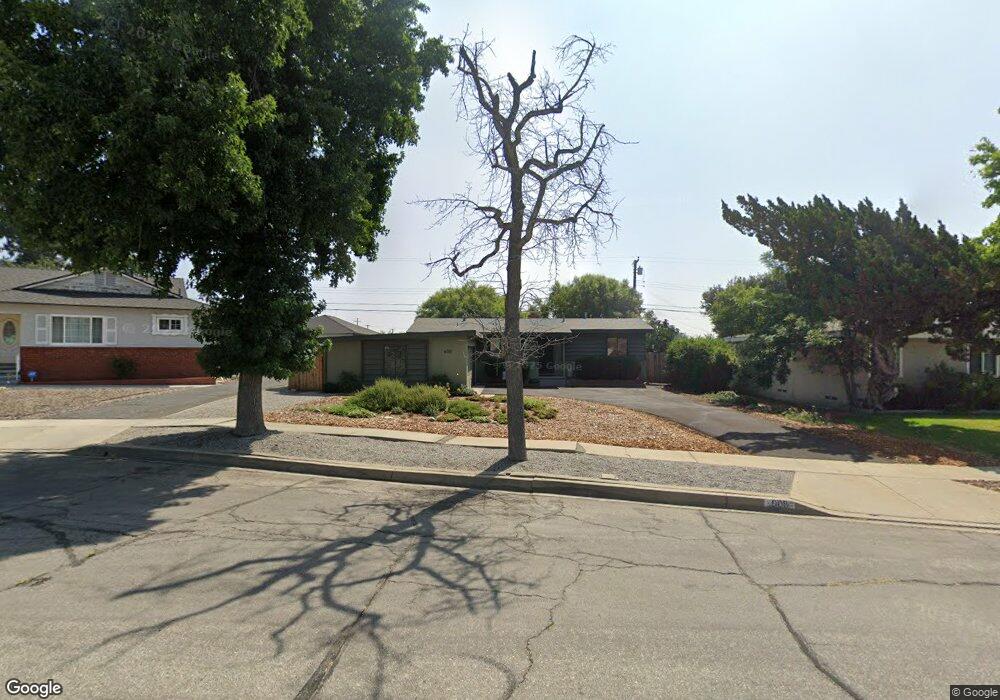
608 Maple Way Upland, CA 91786
Estimated Value: $689,965 - $735,000
3
Beds
2
Baths
1,250
Sq Ft
$570/Sq Ft
Est. Value
About This Home
This home is located at 608 Maple Way, Upland, CA 91786 and is currently estimated at $712,491, approximately $569 per square foot. 608 Maple Way is a home located in San Bernardino County with nearby schools including Baldy View Elementary School, Upland Junior High School, and Upland High School.
Ownership History
Date
Name
Owned For
Owner Type
Purchase Details
Closed on
Sep 18, 2023
Sold by
Turrentine Christine C
Bought by
Christine C Turrentine Living Trust and Turrentine
Current Estimated Value
Purchase Details
Closed on
Jan 2, 2008
Sold by
Deniz Robert
Bought by
Turrentine Christine
Home Financials for this Owner
Home Financials are based on the most recent Mortgage that was taken out on this home.
Original Mortgage
$203,523
Interest Rate
6.05%
Mortgage Type
New Conventional
Purchase Details
Closed on
Nov 16, 1999
Sold by
Upland Manor Inc
Bought by
Deniz Robert and Turrentine Christine
Home Financials for this Owner
Home Financials are based on the most recent Mortgage that was taken out on this home.
Original Mortgage
$139,680
Interest Rate
7.96%
Purchase Details
Closed on
Apr 23, 1996
Sold by
The Pacific Conference Of The Brethren I
Bought by
Upland Manor Inc
Create a Home Valuation Report for This Property
The Home Valuation Report is an in-depth analysis detailing your home's value as well as a comparison with similar homes in the area
Home Values in the Area
Average Home Value in this Area
Purchase History
| Date | Buyer | Sale Price | Title Company |
|---|---|---|---|
| Christine C Turrentine Living Trust | -- | None Listed On Document | |
| Turrentine Christine | -- | Chicago Title | |
| Deniz Robert | $145,500 | Fidelity National Title Co | |
| Upland Manor Inc | -- | Chicago Title Co |
Source: Public Records
Mortgage History
| Date | Status | Borrower | Loan Amount |
|---|---|---|---|
| Previous Owner | Turrentine Christine | $203,523 | |
| Previous Owner | Deniz Robert | $139,680 |
Source: Public Records
Tax History
| Year | Tax Paid | Tax Assessment Tax Assessment Total Assessment is a certain percentage of the fair market value that is determined by local assessors to be the total taxable value of land and additions on the property. | Land | Improvement |
|---|---|---|---|---|
| 2025 | $3,516 | $315,414 | $105,516 | $209,898 |
| 2024 | $3,403 | $309,229 | $103,447 | $205,782 |
| 2023 | $3,350 | $303,166 | $101,419 | $201,747 |
| 2022 | $3,698 | $297,221 | $99,430 | $197,791 |
| 2021 | $3,268 | $291,393 | $97,480 | $193,913 |
| 2020 | $3,179 | $288,405 | $96,480 | $191,925 |
| 2019 | $3,167 | $282,750 | $94,588 | $188,162 |
| 2018 | $3,090 | $277,206 | $92,733 | $184,473 |
| 2017 | $3,000 | $271,771 | $90,915 | $180,856 |
| 2016 | $2,804 | $266,442 | $89,132 | $177,310 |
| 2015 | $2,740 | $262,440 | $87,793 | $174,647 |
| 2014 | $2,668 | $257,299 | $86,073 | $171,226 |
Source: Public Records
Map
Nearby Homes
- 633 Maple Way
- 595 Juniper Ave
- 885 W Arrow Hwy
- 0 Bay St Unit AR25093919
- 846 Amber Ct
- 856 Altura Way
- 762 N Vallejo Way
- 617 N Ukiah Way
- 435 W 9th St Unit B3
- 1019 W Pine St
- 1089 W Pine St Unit E
- 910 N Redding Way Unit I
- 910 N Redding Way Unit F
- 1223 Lenwood Square
- 855 N Palm Ave
- 636 N Palm Ave
- 1496 Corte Hacienda Unit 1
- 134 Coral Way
- 428 W 8th St
- 306 S Vallejo Way
Your Personal Tour Guide
Ask me questions while you tour the home.