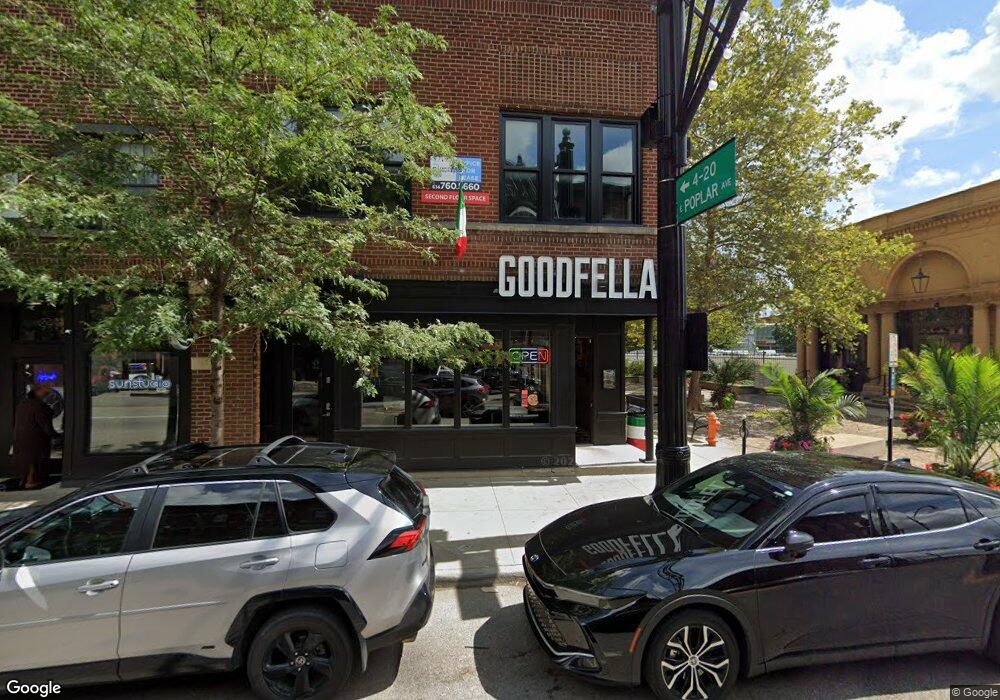
608 N High St Columbus, OH 43215
Short North Neighborhood
--
Bed
--
Bath
7,372
Sq Ft
3,528
Sq Ft Lot
About This Home
This home is located at 608 N High St, Columbus, OH 43215. 608 N High St is a home located in Franklin County with nearby schools including Hubbard Elementary School, Dominion Middle School, and Whetstone High School.
Ownership History
Date
Name
Owned For
Owner Type
Purchase Details
Closed on
Mar 13, 2025
Sold by
Roseboro Anthony M
Bought by
City Of Columbus Ohio
Purchase Details
Closed on
Oct 29, 2021
Sold by
Battersea Development Sub Llc
Bought by
Battersea Development Sub 608 Llc
Purchase Details
Closed on
Apr 5, 2013
Sold by
C & W Investment Company Llc
Bought by
C & W 608 North High Llc
Home Financials for this Owner
Home Financials are based on the most recent Mortgage that was taken out on this home.
Original Mortgage
$1,248,000
Interest Rate
3.5%
Mortgage Type
Future Advance Clause Open End Mortgage
Purchase Details
Closed on
Mar 5, 2003
Sold by
C & W Investment Co
Bought by
C & W Investment Co Llc
Purchase Details
Closed on
Sep 29, 1994
Sold by
Weidner Lorraine
Bought by
C & W Investment Co
Home Financials for this Owner
Home Financials are based on the most recent Mortgage that was taken out on this home.
Original Mortgage
$400,000
Interest Rate
8.6%
Mortgage Type
Commercial
Purchase Details
Closed on
Dec 28, 1987
Create a Home Valuation Report for This Property
The Home Valuation Report is an in-depth analysis detailing your home's value as well as a comparison with similar homes in the area
Home Values in the Area
Average Home Value in this Area
Purchase History
| Date | Buyer | Sale Price | Title Company |
|---|---|---|---|
| City Of Columbus Ohio | -- | None Listed On Document | |
| Battersea Development Sub 608 Llc | -- | Search 2 Close | |
| C & W 608 North High Llc | -- | None Available | |
| C & W Investment Co Llc | -- | -- | |
| C & W Investment Co | $500,000 | -- | |
| -- | -- | -- |
Source: Public Records
Mortgage History
| Date | Status | Borrower | Loan Amount |
|---|---|---|---|
| Previous Owner | C & W 608 North High Llc | $1,248,000 | |
| Previous Owner | C & W Investment Co | $400,000 |
Source: Public Records
Tax History Compared to Growth
Tax History
| Year | Tax Paid | Tax Assessment Tax Assessment Total Assessment is a certain percentage of the fair market value that is determined by local assessors to be the total taxable value of land and additions on the property. | Land | Improvement |
|---|---|---|---|---|
| 2024 | $19,872 | $255,330 | $25,620 | $229,710 |
| 2023 | $18,510 | $240,590 | $25,620 | $214,970 |
| 2022 | $19,988 | $257,600 | $42,630 | $214,970 |
| 2021 | $20,071 | $257,600 | $42,630 | $214,970 |
| 2020 | $10,908 | $136,870 | $21,780 | $115,090 |
| 2019 | $10,142 | $119,010 | $18,940 | $100,070 |
| 2018 | $9,386 | $119,010 | $18,940 | $100,070 |
| 2017 | $10,131 | $119,010 | $18,940 | $100,070 |
| 2016 | $9,312 | $103,090 | $18,940 | $84,150 |
| 2015 | $8,330 | $103,090 | $18,940 | $84,150 |
| 2014 | $8,326 | $103,090 | $18,940 | $84,150 |
| 2013 | $2,761 | $64,750 | $15,785 | $48,965 |
Source: Public Records
Map
Nearby Homes
- 26 Victorian Gate Way
- 674 Park St
- 46 W Russell St
- 46 Victorian Gate Way
- 37 Buttles Ave Unit D
- 89 E Lincoln St
- 769 N High St Unit 303
- 769 N High St Unit 304
- 845 N High St Unit 501 & 502
- 11 W 1st Ave Unit B
- 835 Summit St
- 85-91 W 1st Ave
- 69-71 E 1st Ave
- 83 W 1st Ave
- 751 N 6th St Unit 410
- 270 Dickenson St Unit 303
- 270 Dickenson St Unit 402
- 270 Dickenson St Unit 403
- 270 Dickenson St Unit 301
- 270 Dickenson St Unit 201
- 605 N High St
- 601 N High St Unit 204
- 601 N High St Unit 201
- 601 N High St Unit 2B
- 601 N High St Unit 314
- 601 N High St Unit 212
- 601 N High St Unit 305
- 601 N High St Unit 212
- 587 N High St
- 12 W Poplar Ave Unit 314
- 12 W Poplar Ave Unit 313
- 12 W Poplar Ave Unit 312
- 12 W Poplar Ave Unit 311
- 12 W Poplar Ave Unit 310
- 12 W Poplar Ave Unit 309
- 12 W Poplar Ave Unit 308
- 12 W Poplar Ave Unit 307
- 12 W Poplar Ave Unit 306
- 12 W Poplar Ave Unit 305
- 12 W Poplar Ave Unit 304