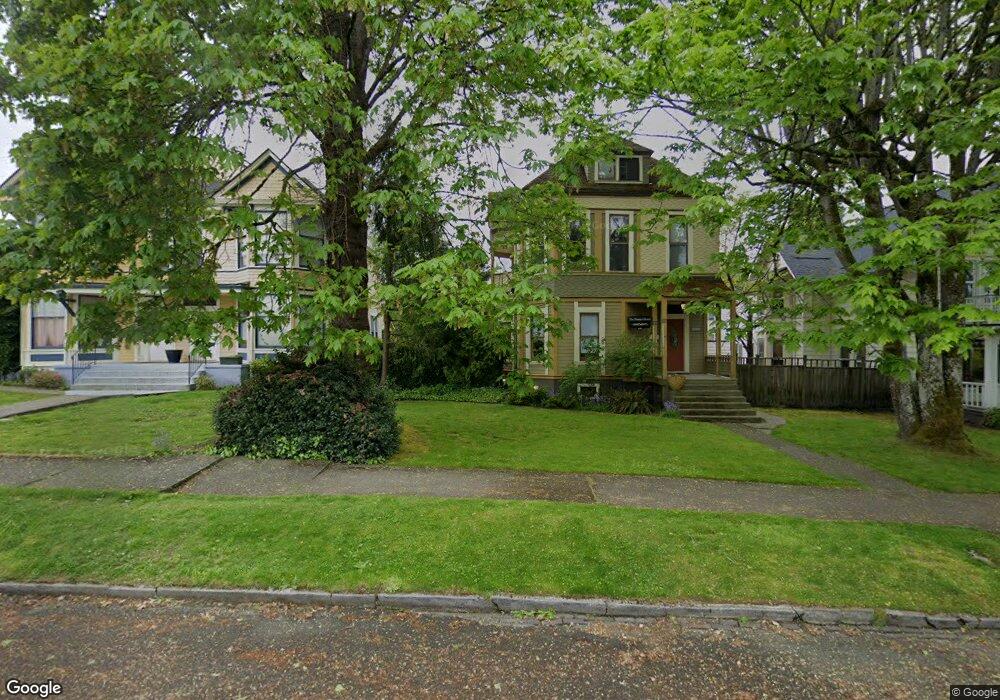
608 N I St Unit A-B Tacoma, WA 98403
North Tacoma NeighborhoodEstimated Value: $768,000 - $857,000
4
Beds
2
Baths
309
Sq Ft
$2,639/Sq Ft
Est. Value
About This Home
This home is located at 608 N I St Unit A-B, Tacoma, WA 98403 and is currently estimated at $815,357, approximately $2,638 per square foot. 608 N I St Unit A-B is a home located in Pierce County with nearby schools including Lowell Elementary School, Hilltop Heritage Middle School, and Stadium High School.
Ownership History
Date
Name
Owned For
Owner Type
Purchase Details
Closed on
Dec 30, 2019
Sold by
Vanharten Duggan Cathy and Denis Peter Paul Duggan
Bought by
Vanharten Duggan Cathy
Current Estimated Value
Home Financials for this Owner
Home Financials are based on the most recent Mortgage that was taken out on this home.
Original Mortgage
$350,000
Outstanding Balance
$309,239
Interest Rate
3.6%
Mortgage Type
New Conventional
Estimated Equity
$506,118
Purchase Details
Closed on
Nov 5, 2018
Sold by
Duggan Denis P and Duggan Cathy V
Bought by
Denis Peter Paul Duggan and Denis Cathy Jo Van
Purchase Details
Closed on
Jun 30, 2008
Sold by
Hunter Jack A and Hunter Betsy E
Bought by
Duggan Denis P and Duggan Cathy V
Home Financials for this Owner
Home Financials are based on the most recent Mortgage that was taken out on this home.
Original Mortgage
$286,875
Interest Rate
6%
Mortgage Type
Purchase Money Mortgage
Create a Home Valuation Report for This Property
The Home Valuation Report is an in-depth analysis detailing your home's value as well as a comparison with similar homes in the area
Home Values in the Area
Average Home Value in this Area
Purchase History
| Date | Buyer | Sale Price | Title Company |
|---|---|---|---|
| Vanharten Duggan Cathy | -- | Synrgo | |
| Denis Peter Paul Duggan | -- | None Available | |
| Duggan Denis P | $382,500 | Rainier Title |
Source: Public Records
Mortgage History
| Date | Status | Borrower | Loan Amount |
|---|---|---|---|
| Open | Vanharten Duggan Cathy | $350,000 | |
| Closed | Duggan Denis P | $286,875 |
Source: Public Records
Tax History Compared to Growth
Tax History
| Year | Tax Paid | Tax Assessment Tax Assessment Total Assessment is a certain percentage of the fair market value that is determined by local assessors to be the total taxable value of land and additions on the property. | Land | Improvement |
|---|---|---|---|---|
| 2025 | $7,948 | $782,800 | $361,100 | $421,700 |
| 2024 | $7,948 | $777,000 | $339,000 | $438,000 |
| 2023 | $7,948 | $714,500 | $302,200 | $412,300 |
| 2022 | $6,944 | $719,200 | $348,200 | $371,000 |
| 2021 | $6,732 | $536,100 | $230,700 | $305,400 |
| 2019 | $5,923 | $495,000 | $191,500 | $303,500 |
| 2018 | $6,208 | $456,100 | $169,700 | $286,400 |
| 2017 | $5,403 | $393,300 | $147,800 | $245,500 |
| 2016 | $5,278 | $315,400 | $101,900 | $213,500 |
| 2014 | $4,453 | $303,800 | $95,400 | $208,400 |
| 2013 | $4,453 | $277,500 | $80,500 | $197,000 |
Source: Public Records
Map
Nearby Homes