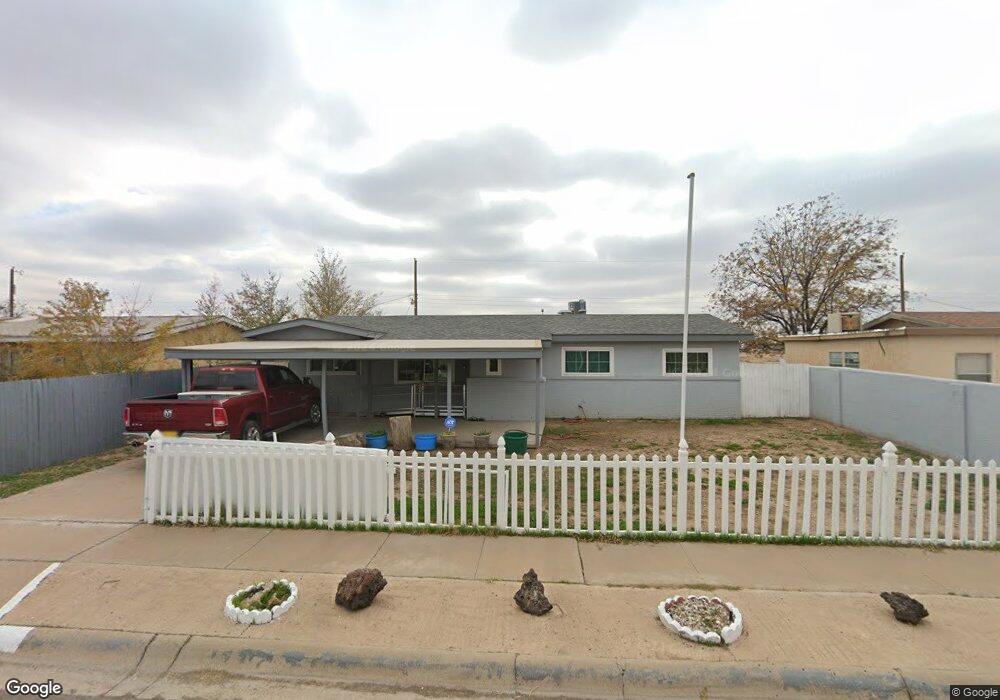
608 Redwood St Roswell, NM 88203
Estimated Value: $113,000 - $192,000
--
Bed
--
Bath
1,367
Sq Ft
$113/Sq Ft
Est. Value
About This Home
This home is located at 608 Redwood St, Roswell, NM 88203 and is currently estimated at $154,405, approximately $112 per square foot. 608 Redwood St is a home located in Chaves County with nearby schools including Monterrey Elementary School, Mountain View Middle School, and Roswell High School.
Create a Home Valuation Report for This Property
The Home Valuation Report is an in-depth analysis detailing your home's value as well as a comparison with similar homes in the area
Home Values in the Area
Average Home Value in this Area
Tax History Compared to Growth
Tax History
| Year | Tax Paid | Tax Assessment Tax Assessment Total Assessment is a certain percentage of the fair market value that is determined by local assessors to be the total taxable value of land and additions on the property. | Land | Improvement |
|---|---|---|---|---|
| 2025 | $613 | $24,984 | $1,953 | $23,031 |
| 2024 | $613 | $24,256 | $1,925 | $22,331 |
| 2023 | $613 | $23,549 | $1,898 | $21,651 |
| 2022 | $588 | $22,864 | $1,817 | $21,047 |
| 2021 | $582 | $22,198 | $1,751 | $20,447 |
| 2020 | $564 | $21,552 | $1,671 | $19,881 |
| 2019 | $545 | $20,924 | $1,593 | $19,331 |
| 2018 | $527 | $20,315 | $1,527 | $18,788 |
| 2017 | $506 | $19,723 | $1,495 | $18,228 |
| 2016 | $484 | $19,149 | $1,444 | $17,705 |
| 2015 | $515 | $18,591 | $1,403 | $17,188 |
| 2014 | $998 | $18,049 | $1,364 | $16,685 |
Source: Public Records
Map
Nearby Homes
- 702 Hickory Dr
- 2904 S Lea Ave
- 100 Blk Jaffa St
- 500 W Brasher #78 Rd
- 000 S Washington Ave
- 704 W Gayle St
- 2800 W Onyx St
- 2710 W Onyx St
- 2706 W Onyx St
- 609 W Gayle St
- 2705 S Onyx Dr
- 600 Barnett Dr
- 5905 S Main St
- 8703 S Main St
- 2698 S Main St
- 5901 S Main St
- 5831 S Main St
- 2103 S Main St
- 1202 Baylor Dr
- 3801 S Main St