Estimated Value: $103,000 - $154,000
2
Beds
1
Bath
1,106
Sq Ft
$115/Sq Ft
Est. Value
About This Home
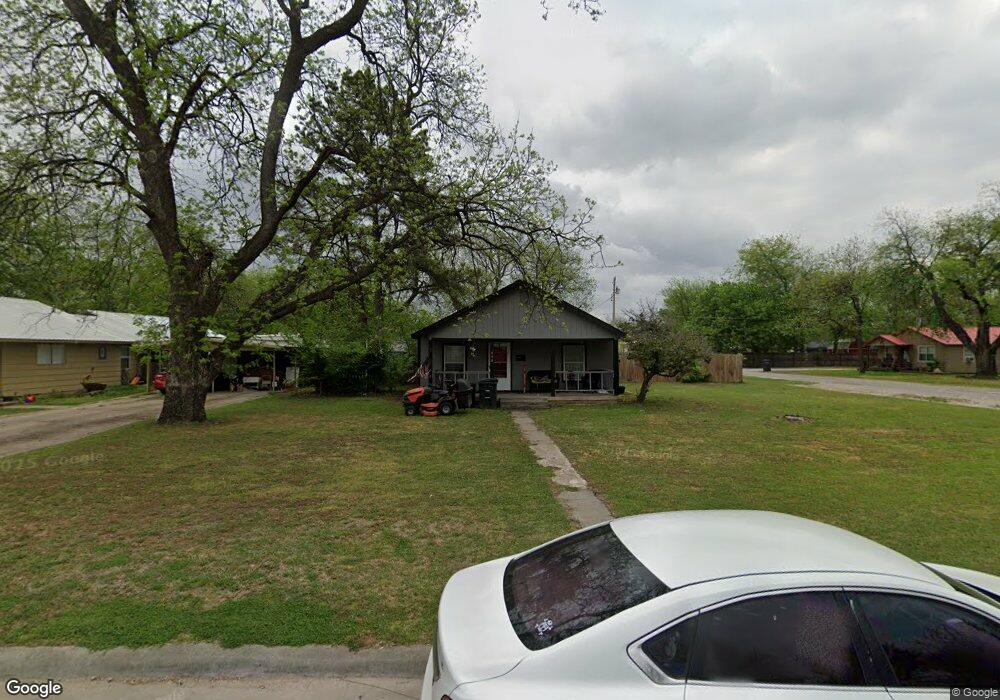
This home is located at 608 S 2nd St, Davis, OK 73030 and is currently estimated at $126,951, approximately $114 per square foot. 608 S 2nd St is a home located in Murray County with nearby schools including Davis Elementary School, Davis Middle School, and Davis High School.
Ownership History
Date
Name
Owned For
Owner Type
Purchase Details
Closed on
Oct 25, 2022
Sold by
Pirkle Joe B
Current Estimated Value
Home Financials for this Owner
Home Financials are based on the most recent Mortgage that was taken out on this home.
Original Mortgage
$48,700
Outstanding Balance
$41,955
Interest Rate
6.09%
Mortgage Type
New Conventional
Estimated Equity
$84,996
Purchase Details
Closed on
Sep 29, 2017
Sold by
Johnson Sandy
Bought by
Burch Cody James and Burch Brooke Lindsey
Purchase Details
Closed on
Aug 16, 2013
Sold by
Finley David Allen and Finley Myra Lynn
Bought by
Burch Cody and Burch Brooke
Home Financials for this Owner
Home Financials are based on the most recent Mortgage that was taken out on this home.
Original Mortgage
$49,844
Interest Rate
4.34%
Mortgage Type
New Conventional
Purchase Details
Closed on
Jun 2, 2006
Sold by
Chapmond Randy and Chapmond Angela
Bought by
Finley David Allen and Finley Myra Lynn
Create a Home Valuation Report for This Property
The Home Valuation Report is an in-depth analysis detailing your home's value as well as a comparison with similar homes in the area
Home Values in the Area
Average Home Value in this Area
Purchase History
| Date | Buyer | Sale Price | Title Company |
|---|---|---|---|
| -- | -- | -- | |
| Burch Cody James | -- | None Available | |
| Burch Cody | $63,000 | None Available | |
| Finley David Allen | $57,000 | None Available |
Source: Public Records
Mortgage History
| Date | Status | Borrower | Loan Amount |
|---|---|---|---|
| Open | Record Owners | $48,700 | |
| Previous Owner | Burch Cody | $49,844 |
Source: Public Records
Tax History
| Year | Tax Paid | Tax Assessment Tax Assessment Total Assessment is a certain percentage of the fair market value that is determined by local assessors to be the total taxable value of land and additions on the property. | Land | Improvement |
|---|---|---|---|---|
| 2025 | $578 | $6,242 | $1,132 | $5,110 |
| 2024 | $579 | $5,945 | $660 | $5,285 |
| 2023 | $558 | $6,930 | $660 | $6,270 |
| 2022 | $676 | $6,930 | $660 | $6,270 |
| 2021 | $668 | $6,930 | $660 | $6,270 |
| 2020 | $643 | $6,930 | $660 | $6,270 |
| 2019 | $655 | $6,930 | $660 | $6,270 |
| 2018 | $650 | $6,930 | $660 | $6,270 |
| 2017 | $651 | $6,930 | $660 | $6,270 |
| 2016 | $655 | $6,930 | $250 | $6,680 |
| 2015 | $606 | $6,930 | $250 | $6,680 |
| 2014 | $610 | $6,930 | $250 | $6,680 |
Source: Public Records
Map
Nearby Homes
Your Personal Tour Guide
Ask me questions while you tour the home.