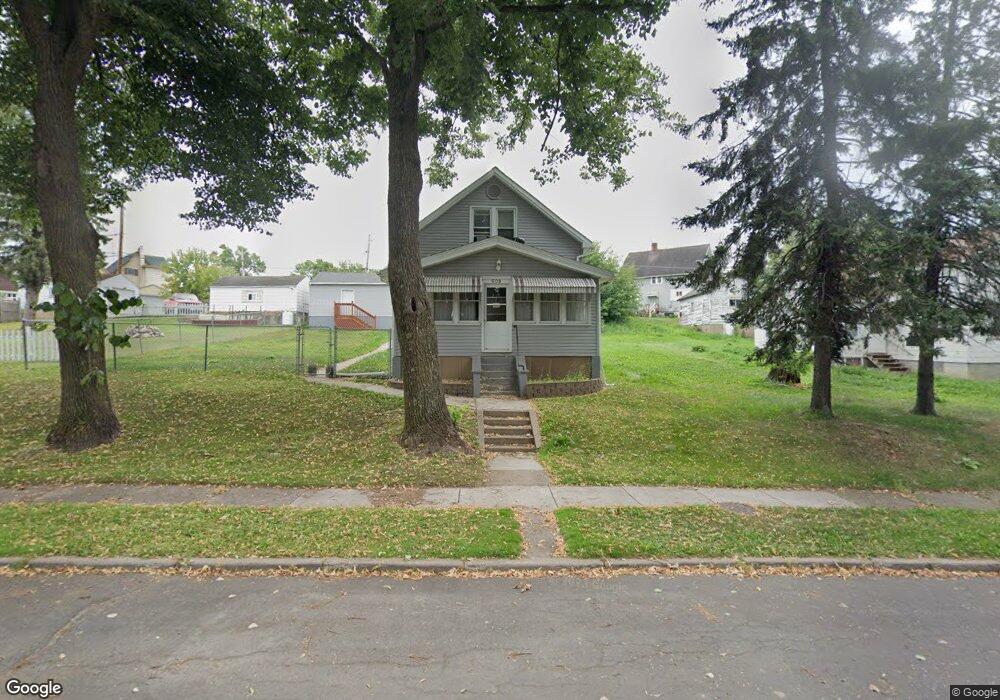
608 South Ct Eveleth, MN 55734
Estimated Value: $83,000 - $122,000
3
Beds
1
Bath
900
Sq Ft
$120/Sq Ft
Est. Value
About This Home
This home is located at 608 South Ct, Eveleth, MN 55734 and is currently estimated at $107,855, approximately $119 per square foot. 608 South Ct is a home located in St. Louis County with nearby schools including Nelle Shean Elementary School, Franklin Elementary School, and Eveleth-Gilbert Junior High School.
Ownership History
Date
Name
Owned For
Owner Type
Purchase Details
Closed on
Dec 23, 2020
Sold by
Sandberg Cameron A and Sandberg Lori A
Bought by
Klander Krystal Rose
Current Estimated Value
Home Financials for this Owner
Home Financials are based on the most recent Mortgage that was taken out on this home.
Original Mortgage
$78,750
Outstanding Balance
$70,433
Interest Rate
2.7%
Mortgage Type
Commercial
Estimated Equity
$37,422
Create a Home Valuation Report for This Property
The Home Valuation Report is an in-depth analysis detailing your home's value as well as a comparison with similar homes in the area
Home Values in the Area
Average Home Value in this Area
Purchase History
| Date | Buyer | Sale Price | Title Company |
|---|---|---|---|
| Klander Krystal Rose | $87,500 | All American Title | |
| Klander Krystal Krystal | $87,500 | -- |
Source: Public Records
Mortgage History
| Date | Status | Borrower | Loan Amount |
|---|---|---|---|
| Open | Klander Krystal Rose | $78,750 | |
| Closed | Klander Krystal Rose | $78,750 | |
| Closed | Klander Krystal Krystal | $78,750 |
Source: Public Records
Tax History Compared to Growth
Tax History
| Year | Tax Paid | Tax Assessment Tax Assessment Total Assessment is a certain percentage of the fair market value that is determined by local assessors to be the total taxable value of land and additions on the property. | Land | Improvement |
|---|---|---|---|---|
| 2023 | $618 | $82,800 | $7,500 | $75,300 |
| 2022 | $546 | $62,600 | $6,800 | $55,800 |
| 2021 | $450 | $58,800 | $6,200 | $52,600 |
| 2020 | $430 | $58,800 | $6,200 | $52,600 |
| 2019 | $354 | $58,800 | $6,200 | $52,600 |
| 2018 | $254 | $58,800 | $6,200 | $52,600 |
| 2017 | $196 | $52,600 | $6,200 | $46,400 |
| 2016 | $166 | $46,100 | $6,300 | $39,800 |
| 2015 | $142 | $27,700 | $3,800 | $23,900 |
| 2014 | $142 | $25,100 | $3,800 | $21,300 |
Source: Public Records
Map
Nearby Homes