A
Seller's Agent in 2025
Anthony Robinson
Comfort Real Estate Services
(805) 388-8212
1 in this area
4 Total Sales
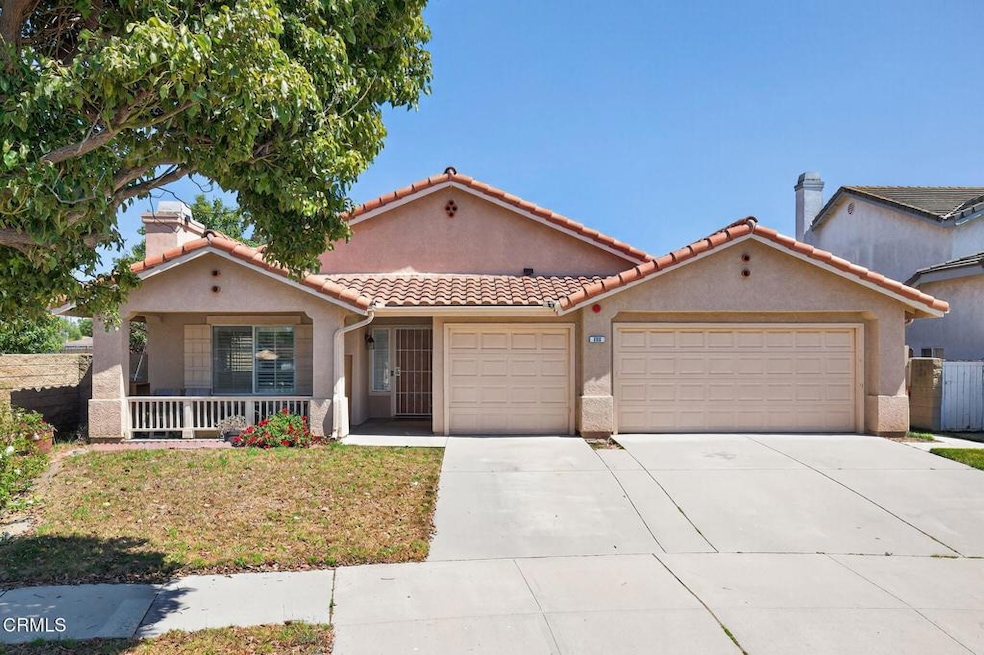
Welcome to this well-maintained 3 bedroom, 2 bathroom home, lovingly cared for by its original owner since it was built in 1994. Step inside to find a bright and inviting floor plan featuring a cozy fireplace, wood-like floors, and a spacious living area perfect for gatherings.The kitchen offers a long counter design, providing plenty of space for meal prep, entertaining, or casual dining, while the adjoining dining area creates a warm and functional flow. The primary suite is complete with dual sinks in the master bath for added convenience.Outside, enjoy a generous backyard ideal for entertaining, gardening, or relaxing in the coastal breeze. Additional highlights include a rare 3-car garage, providing ample storage and parking.Perfectly located just minutes from the beach, and freeway access, this home blends comfort, practicality, and coastal living.
Last Agent to Sell the Property
Comfort Real Estate Services License #02129406 Listed on: 09/05/2025
Co-Listed By
Ana Topete
Comfort Real Estate Services License #02204510
| Date | Type | Sale Price | Title Company |
|---|---|---|---|
| Grant Deed | $802,000 | 805Title | |
| Interfamily Deed Transfer | -- | None Available | |
| Grant Deed | $186,500 | Chicago Title |
| Date | Status | Loan Amount | Loan Type |
|---|---|---|---|
| Open | $748,981 | New Conventional | |
| Previous Owner | $149,200 | No Value Available |
| Date | Event | Price | List to Sale | Price per Sq Ft |
|---|---|---|---|---|
| 10/03/2025 10/03/25 | Sold | $802,000 | +6.9% | $584 / Sq Ft |
| 09/11/2025 09/11/25 | Pending | -- | -- | -- |
| 09/04/2025 09/04/25 | For Sale | $750,000 | -- | $546 / Sq Ft |
| Year | Tax Paid | Tax Assessment Tax Assessment Total Assessment is a certain percentage of the fair market value that is determined by local assessors to be the total taxable value of land and additions on the property. | Land | Improvement |
|---|---|---|---|---|
| 2025 | $3,906 | $317,913 | $125,285 | $192,628 |
| 2024 | $3,906 | $311,680 | $122,829 | $188,851 |
| 2023 | $3,735 | $305,569 | $120,420 | $185,149 |
| 2022 | $3,627 | $299,578 | $118,059 | $181,519 |
| 2021 | $3,627 | $293,704 | $115,744 | $177,960 |
| 2020 | $3,691 | $290,694 | $114,558 | $176,136 |
| 2019 | $3,589 | $284,995 | $112,312 | $172,683 |
| 2018 | $3,539 | $279,408 | $110,110 | $169,298 |
| 2017 | $3,364 | $273,930 | $107,951 | $165,979 |
| 2016 | $3,249 | $268,560 | $105,835 | $162,725 |
| 2015 | $3,281 | $264,529 | $104,247 | $160,282 |
| 2014 | $3,245 | $259,350 | $102,206 | $157,144 |
A
Seller's Agent in 2025
Anthony Robinson
Comfort Real Estate Services
(805) 388-8212
1 in this area
4 Total Sales
A
Seller Co-Listing Agent in 2025
Ana Topete
Comfort Real Estate Services

Buyer's Agent in 2025
Veronica Salazar
Century 21 Masters
(805) 312-3969
1 in this area
101 Total Sales
Source: Ventura County Regional Data Share
MLS Number: V1-32167
APN: 185-0-156-015
Disclaimer: Certain information contained herein is derived from information provided by parties other than Homes.com. All information provided is deemed reliable, but is not guaranteed to be accurate and should be independently verified.
![]() IDX information is provided exclusively for personal, non-commercial use, and may not be used for any purpose other than to identify prospective properties consumers may be interested in purchasing. Information is deemed reliable but not guaranteed.
IDX information is provided exclusively for personal, non-commercial use, and may not be used for any purpose other than to identify prospective properties consumers may be interested in purchasing. Information is deemed reliable but not guaranteed.
Ask me questions while you tour the home.