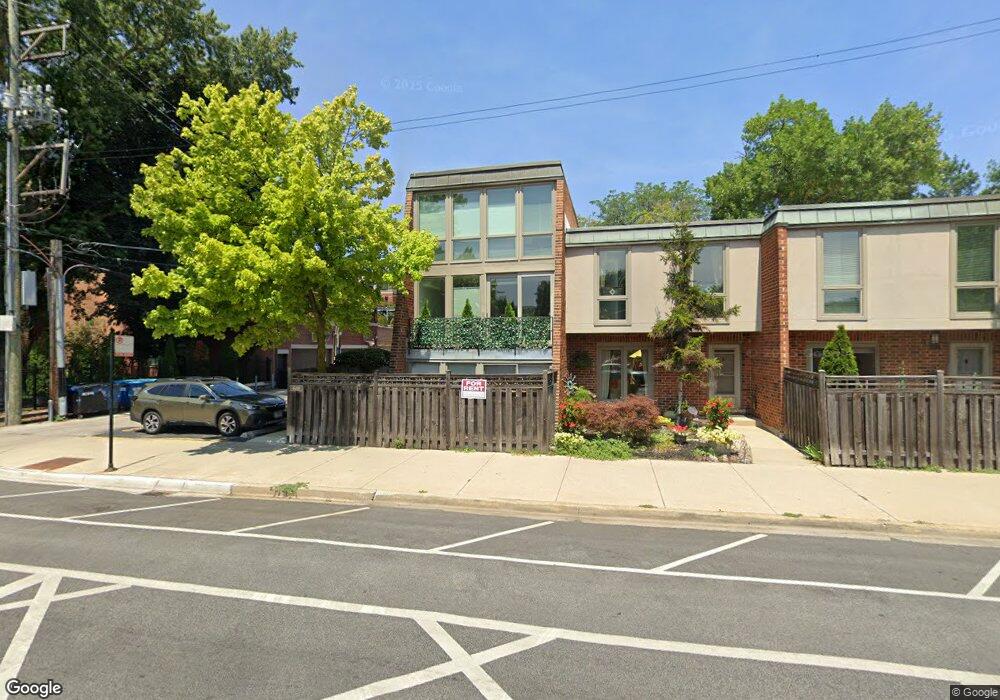
608 W Armitage Ave Unit A2 Chicago, IL 60614
Lincoln Park NeighborhoodEstimated Value: $570,000 - $738,995
2
Beds
3
Baths
1,400
Sq Ft
$448/Sq Ft
Est. Value
About This Home
This home is located at 608 W Armitage Ave Unit A2, Chicago, IL 60614 and is currently estimated at $626,999, approximately $447 per square foot. 608 W Armitage Ave Unit A2 is a home located in Cook County with nearby schools including Abraham Lincoln Elementary School, Lincoln Park High School, and St. James Lutheran School.
Ownership History
Date
Name
Owned For
Owner Type
Purchase Details
Closed on
May 20, 2025
Sold by
West G Bradley G and West Elizabeth
Bought by
Lynch Colin Thomas and Boniszyn Jeanne-Claire
Current Estimated Value
Home Financials for this Owner
Home Financials are based on the most recent Mortgage that was taken out on this home.
Original Mortgage
$275,000
Outstanding Balance
$271,231
Interest Rate
6.13%
Mortgage Type
New Conventional
Estimated Equity
$355,768
Purchase Details
Closed on
May 19, 2025
Sold by
Schulze Richard and Schulze Margaret Obrien
Bought by
West G Bradley G and West Elizabeth
Home Financials for this Owner
Home Financials are based on the most recent Mortgage that was taken out on this home.
Original Mortgage
$275,000
Outstanding Balance
$271,231
Interest Rate
6.13%
Mortgage Type
New Conventional
Estimated Equity
$355,768
Purchase Details
Closed on
May 18, 2005
Sold by
Cammenga Phillip
Bought by
Schulze Richard and Bradley West G
Create a Home Valuation Report for This Property
The Home Valuation Report is an in-depth analysis detailing your home's value as well as a comparison with similar homes in the area
Home Values in the Area
Average Home Value in this Area
Purchase History
| Date | Buyer | Sale Price | Title Company |
|---|---|---|---|
| Lynch Colin Thomas | $580,000 | None Listed On Document | |
| West G Bradley G | -- | None Listed On Document | |
| Schulze Richard | $358,500 | Ticor Title Insurance Compan |
Source: Public Records
Mortgage History
| Date | Status | Borrower | Loan Amount |
|---|---|---|---|
| Open | Lynch Colin Thomas | $275,000 |
Source: Public Records
Tax History Compared to Growth
Tax History
| Year | Tax Paid | Tax Assessment Tax Assessment Total Assessment is a certain percentage of the fair market value that is determined by local assessors to be the total taxable value of land and additions on the property. | Land | Improvement |
|---|---|---|---|---|
| 2024 | $11,058 | $50,470 | $13,575 | $36,895 |
| 2023 | $10,780 | $52,412 | $10,948 | $41,464 |
| 2022 | $10,780 | $52,412 | $10,948 | $41,464 |
| 2021 | $10,539 | $52,410 | $10,947 | $41,463 |
| 2020 | $9,954 | $44,683 | $9,634 | $35,049 |
| 2019 | $9,750 | $48,531 | $9,634 | $38,897 |
| 2018 | $9,587 | $48,531 | $9,634 | $38,897 |
| 2017 | $10,029 | $46,589 | $7,882 | $38,707 |
| 2016 | $9,331 | $46,589 | $7,882 | $38,707 |
| 2015 | $8,537 | $46,589 | $7,882 | $38,707 |
| 2014 | $6,843 | $36,882 | $5,911 | $30,971 |
| 2013 | $6,708 | $36,882 | $5,911 | $30,971 |
Source: Public Records
Map
Nearby Homes
- 2045 N Larrabee St Unit 7106
- 545 W Dickens Ave
- 2054 N Mohawk St
- 450 W Armitage Ave Unit 1
- 1964 N Burling St
- 2334 N Cleveland Ave
- 1878 N Orchard St
- 1854 N Howe St
- 1955 N Halsted St Unit 1
- 1865 N Burling St
- 1853 N Burling St
- 1848 N Hudson Ave Unit G
- 1926 N Halsted St
- 1942 N Sedgwick St Unit PH
- 2015 N Dayton St
- 540 W Webster Ave Unit 311
- 1963 N Dayton St
- 2226 N Lincoln Ave Unit 3A
- 401 W Dickens Ave
- 2007 N Sedgwick St Unit 202
- 608 W Armitage Ave Unit A1
- 606 W Armitage Ave
- 602 W Armitage Ave
- 600 W Armitage Ave
- 600 W Armitage Ave
- 600 W Armitage Ave Unit 2
- 600 W Armitage Ave
- 600 W Armitage Ave
- 600 W Armitage Ave Unit 2
- 600 W Armitage Ave Unit 1
- 2010 N Larrabee St Unit 2010
- 2010 N Larrabee St
- 2012 N Larrabee St
- 2012 N Larrabee St
- 2012 N Larrabee St
- 2012 N Larrabee St
- 2012 N Larrabee St Unit 2
- 2001 N Howe St Unit 3S
- 2001 N Howe St Unit 20013
- 2001 N Howe St Unit 20011