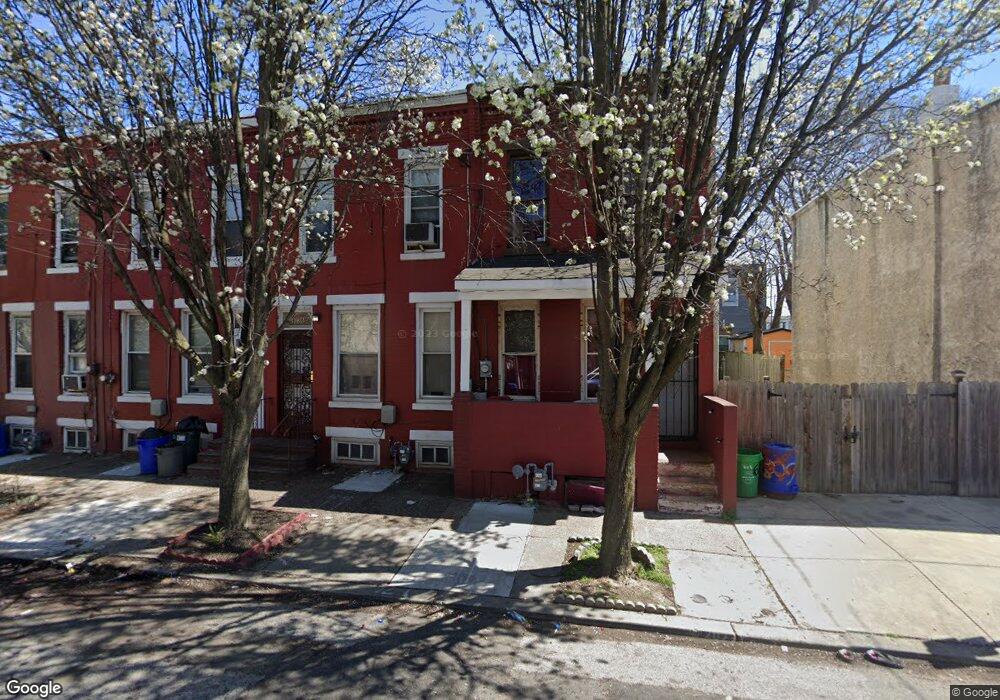
608 West St Camden, NJ 08103
Lanning Square NeighborhoodEstimated Value: $68,000 - $144,000
--
Bed
--
Bath
1,088
Sq Ft
$97/Sq Ft
Est. Value
About This Home
This home is located at 608 West St, Camden, NJ 08103 and is currently estimated at $105,429, approximately $96 per square foot. 608 West St is a home located in Camden County with nearby schools including Camden High School, Hope Community Charter School, and Leap Academy University Charter School.
Ownership History
Date
Name
Owned For
Owner Type
Purchase Details
Closed on
Mar 21, 2025
Sold by
Better Living Residence Llc
Bought by
Negron Rentals Llc
Current Estimated Value
Home Financials for this Owner
Home Financials are based on the most recent Mortgage that was taken out on this home.
Original Mortgage
$108,000
Interest Rate
6.65%
Mortgage Type
Construction
Purchase Details
Closed on
Feb 19, 2025
Sold by
Bush Mary
Bought by
Better Living Residence Llc
Home Financials for this Owner
Home Financials are based on the most recent Mortgage that was taken out on this home.
Original Mortgage
$108,000
Interest Rate
6.65%
Mortgage Type
Construction
Purchase Details
Closed on
Feb 23, 2016
Sold by
Dennis J Zisa Associates Inc
Bought by
Bush Mary and Bush Odell
Home Financials for this Owner
Home Financials are based on the most recent Mortgage that was taken out on this home.
Interest Rate
3.65%
Purchase Details
Closed on
Jun 13, 1998
Sold by
Zisa Robert P
Bought by
Dennis J Zisa & Associates
Purchase Details
Closed on
Dec 30, 1994
Sold by
Tuck Gary
Bought by
Zisa Robert and Zisa Cathleen
Create a Home Valuation Report for This Property
The Home Valuation Report is an in-depth analysis detailing your home's value as well as a comparison with similar homes in the area
Home Values in the Area
Average Home Value in this Area
Purchase History
| Date | Buyer | Sale Price | Title Company |
|---|---|---|---|
| Negron Rentals Llc | $65,000 | None Listed On Document | |
| Negron Rentals Llc | $65,000 | None Listed On Document | |
| Better Living Residence Llc | $25,000 | Title America | |
| Bush Mary | $34,900 | -- | |
| Dennis J Zisa & Associates | $26,572 | -- | |
| Zisa Robert | $12,000 | -- |
Source: Public Records
Mortgage History
| Date | Status | Borrower | Loan Amount |
|---|---|---|---|
| Previous Owner | Negron Rentals Llc | $108,000 | |
| Previous Owner | Bush Mary | -- |
Source: Public Records
Tax History Compared to Growth
Tax History
| Year | Tax Paid | Tax Assessment Tax Assessment Total Assessment is a certain percentage of the fair market value that is determined by local assessors to be the total taxable value of land and additions on the property. | Land | Improvement |
|---|---|---|---|---|
| 2025 | $999 | $28,200 | $4,500 | $23,700 |
| 2024 | $966 | $28,200 | $4,500 | $23,700 |
| 2023 | $966 | $28,200 | $4,500 | $23,700 |
| 2022 | $948 | $28,200 | $4,500 | $23,700 |
| 2021 | $944 | $28,200 | $4,500 | $23,700 |
| 2020 | $897 | $28,200 | $4,500 | $23,700 |
| 2019 | $859 | $28,200 | $4,500 | $23,700 |
| 2018 | $854 | $28,200 | $4,500 | $23,700 |
| 2017 | $833 | $28,200 | $4,500 | $23,700 |
| 2016 | $807 | $28,200 | $4,500 | $23,700 |
| 2015 | $777 | $28,200 | $4,500 | $23,700 |
| 2014 | $758 | $28,200 | $4,500 | $23,700 |
Source: Public Records
Map
Nearby Homes