Estimated Value: $694,000 - $797,000
3
Beds
2
Baths
1,872
Sq Ft
$400/Sq Ft
Est. Value
About This Home
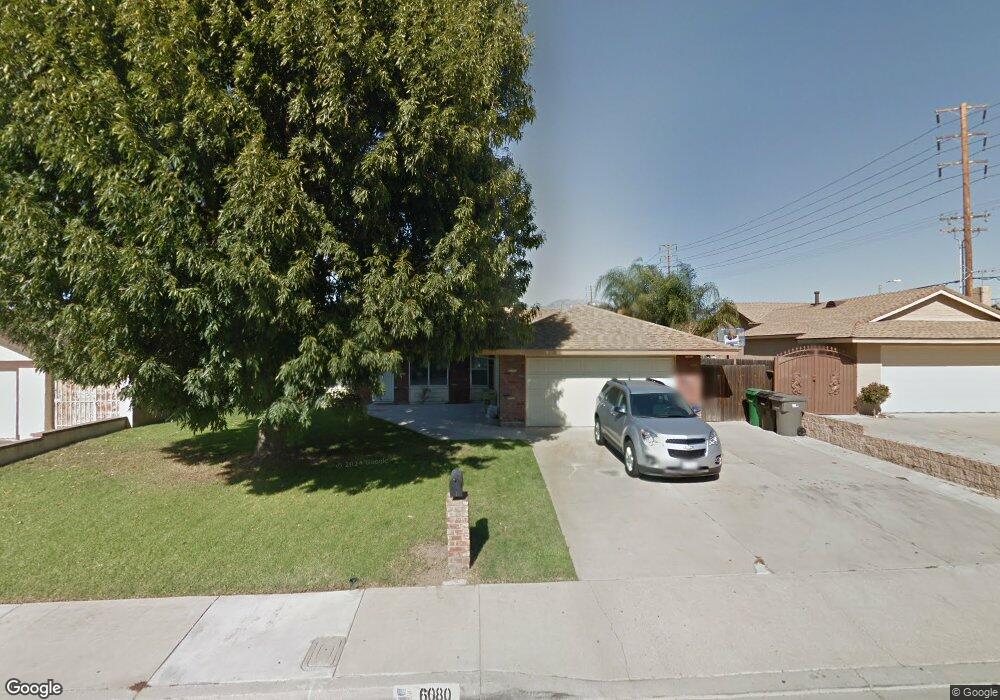
This home is located at 6080 Rosario St, Chino, CA 91710 and is currently estimated at $749,305, approximately $400 per square foot. 6080 Rosario St is a home located in San Bernardino County with nearby schools including Alicia Cortez Elementary, Magnolia Junior High, and Chino High School.
Ownership History
Date
Name
Owned For
Owner Type
Purchase Details
Closed on
Jun 21, 2024
Sold by
Sheron Dekker Of The Revocable Trust and Dekker John H
Bought by
Dekker John
Current Estimated Value
Purchase Details
Closed on
Jun 8, 2011
Sold by
6080 Rosario St Trust
Bought by
Dekker Sheron
Home Financials for this Owner
Home Financials are based on the most recent Mortgage that was taken out on this home.
Original Mortgage
$125,000
Interest Rate
4.46%
Mortgage Type
New Conventional
Purchase Details
Closed on
Nov 9, 2010
Sold by
Finley William L and Finley Judith A
Bought by
6080 Rosario St Trust and Tybo Llc
Purchase Details
Closed on
Aug 25, 1995
Sold by
Doppenberg Arend D and Doppenberg Nena M
Bought by
Finley William L and Finley Judith A
Home Financials for this Owner
Home Financials are based on the most recent Mortgage that was taken out on this home.
Original Mortgage
$123,930
Interest Rate
7.97%
Mortgage Type
Assumption
Create a Home Valuation Report for This Property
The Home Valuation Report is an in-depth analysis detailing your home's value as well as a comparison with similar homes in the area
Home Values in the Area
Average Home Value in this Area
Purchase History
| Date | Buyer | Sale Price | Title Company |
|---|---|---|---|
| Dekker John | -- | None Listed On Document | |
| Dekker Sheron | $260,000 | Southland Title Of Burbank | |
| 6080 Rosario St Trust | $220,700 | Lps Default Title & Closing | |
| Finley William L | $121,500 | Commonwealth Title |
Source: Public Records
Mortgage History
| Date | Status | Borrower | Loan Amount |
|---|---|---|---|
| Previous Owner | Dekker Sheron | $125,000 | |
| Previous Owner | Finley William L | $123,930 |
Source: Public Records
Tax History Compared to Growth
Tax History
| Year | Tax Paid | Tax Assessment Tax Assessment Total Assessment is a certain percentage of the fair market value that is determined by local assessors to be the total taxable value of land and additions on the property. | Land | Improvement |
|---|---|---|---|---|
| 2025 | $4,244 | $390,320 | $114,300 | $276,020 |
| 2024 | $4,244 | $382,667 | $112,059 | $270,608 |
| 2023 | $4,127 | $375,164 | $109,862 | $265,302 |
| 2022 | $4,102 | $367,808 | $107,708 | $260,100 |
| 2021 | $4,022 | $360,596 | $105,596 | $255,000 |
| 2020 | $3,893 | $356,898 | $104,513 | $252,385 |
| 2019 | $3,901 | $416,160 | $156,060 | $260,100 |
| 2018 | $3,738 | $343,039 | $100,455 | $242,584 |
| 2017 | $3,670 | $336,312 | $98,485 | $237,827 |
| 2016 | $3,428 | $329,718 | $96,554 | $233,164 |
| 2015 | $3,373 | $324,766 | $95,104 | $229,662 |
| 2014 | $2,819 | $266,404 | $93,241 | $173,163 |
Source: Public Records
Map
Nearby Homes
- 6031 Rosa Ct
- 6061 Barbara St
- 13014 Bermuda Ave
- 12936 Cambridge Ct
- 5925 Riverside Dr Unit 12
- 12951 Red Cedar Way
- 13555 Magnolia Ave
- 12811 Oaks Ave
- 13536 Sycamore Ln
- 12951 Benson Ave Unit 118
- 6441 Susana St
- 13185 14th St
- 4610 Avondale Ct
- 11610 Granville Place
- 13022 Cypress Ave
- 13006 Falcon Place
- 12796 17th St
- 5640 Riverside Dr Unit 119
- 12947 Robin Ln
- 6630 Mogano Dr
- 6090 Rosario St
- 6060 Rosario St
- 13151 Sequoia Ave
- 13162 Magnolia Ave
- 6075 Rosario St
- 13158 Magnolia Ave
- 13149 Sequoia Ave
- 6087 Rosario St
- 6063 Rosario St
- 6050 Rosario St
- 6051 Rosario St
- 6053 Alfredo St
- 13137 Sequoia Ave
- 13136 Magnolia Ave
- 13201 Rancho Bernard Ct
- 6040 Rosario St
- 6049 Rosario St
- 6041 Alfredo St
- 13125 Sequoia Ave
- 13124 Magnolia Ave