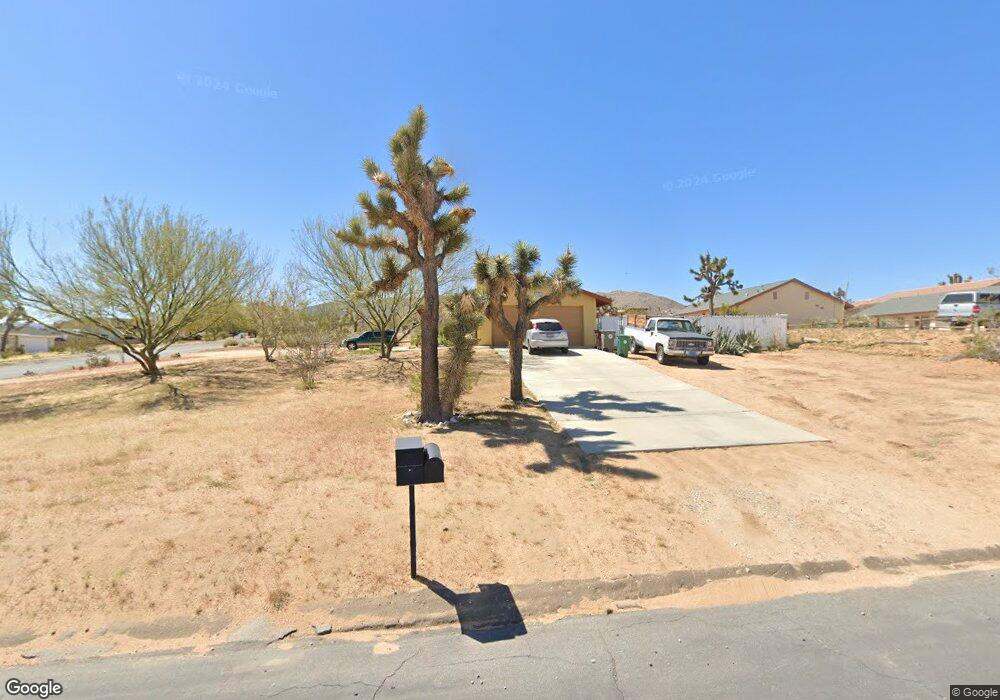
60821 Division St Joshua Tree, CA 92252
Estimated Value: $213,000 - $359,701
3
Beds
2
Baths
1,422
Sq Ft
$206/Sq Ft
Est. Value
About This Home
This home is located at 60821 Division St, Joshua Tree, CA 92252 and is currently estimated at $292,925, approximately $205 per square foot. 60821 Division St is a home located in San Bernardino County with nearby schools including Friendly Hills Elementary School, La Contenta Middle School, and Yucca Valley High School.
Ownership History
Date
Name
Owned For
Owner Type
Purchase Details
Closed on
Sep 10, 2020
Sold by
Logan David
Bought by
Logan David and Rivera Logan Alicia
Current Estimated Value
Purchase Details
Closed on
Dec 3, 1997
Sold by
Logan Alicia
Bought by
Logan David
Home Financials for this Owner
Home Financials are based on the most recent Mortgage that was taken out on this home.
Original Mortgage
$67,800
Interest Rate
7.22%
Mortgage Type
Seller Take Back
Purchase Details
Closed on
Oct 3, 1997
Sold by
Lippitt Joshua A and Lippitt Pamela
Bought by
Federal National Mortgage Association
Purchase Details
Closed on
Jun 23, 1993
Sold by
Lippit Joshua A
Bought by
Lippitt Joshua A and Lippitt Pamela
Home Financials for this Owner
Home Financials are based on the most recent Mortgage that was taken out on this home.
Original Mortgage
$83,200
Interest Rate
4.62%
Create a Home Valuation Report for This Property
The Home Valuation Report is an in-depth analysis detailing your home's value as well as a comparison with similar homes in the area
Home Values in the Area
Average Home Value in this Area
Purchase History
| Date | Buyer | Sale Price | Title Company |
|---|---|---|---|
| Logan David | $110,000 | None Available | |
| Logan David | -- | First American Title | |
| Logan David | $70,000 | First American Title | |
| Federal National Mortgage Association | $62,000 | Orange Coast Title | |
| Lippitt Joshua A | -- | Fidelity National Title Ins |
Source: Public Records
Mortgage History
| Date | Status | Borrower | Loan Amount |
|---|---|---|---|
| Previous Owner | Logan David | $67,800 | |
| Previous Owner | Lippitt Joshua A | $83,200 |
Source: Public Records
Tax History
| Year | Tax Paid | Tax Assessment Tax Assessment Total Assessment is a certain percentage of the fair market value that is determined by local assessors to be the total taxable value of land and additions on the property. | Land | Improvement |
|---|---|---|---|---|
| 2025 | $1,670 | $121,350 | $15,968 | $105,382 |
| 2024 | $1,601 | $118,971 | $15,655 | $103,316 |
| 2023 | $1,570 | $116,638 | $15,348 | $101,290 |
| 2022 | $1,538 | $114,351 | $15,047 | $99,304 |
| 2021 | $1,519 | $112,109 | $14,752 | $97,357 |
| 2020 | $1,505 | $110,960 | $14,601 | $96,359 |
| 2019 | $1,582 | $108,785 | $14,315 | $94,470 |
| 2018 | $1,409 | $106,652 | $14,034 | $92,618 |
| 2017 | $1,394 | $104,561 | $13,759 | $90,802 |
| 2016 | $1,370 | $102,511 | $13,489 | $89,022 |
| 2015 | $1,342 | $100,971 | $13,286 | $87,685 |
| 2014 | $1,350 | $98,993 | $13,026 | $85,967 |
Source: Public Records
Map
Nearby Homes
- 60812 Division St
- 6689 Torres Ave
- 6672 San Angelo Ave
- 6732 San Angelo Ave
- 0 Torres Ave Unit OC25211044
- 6748 San Angelo Ave
- 0 Division St Unit OC25210959
- 7218 Juniper Rd
- 1725 Sunny Vista Rd
- 7032 Saddleback Rd
- 7035 Sunny Vista Rd
- 7505 Sherwood Rd
- 7024 Saddleback Rd
- 6925 Sunnyhill Rd
- 5814 Sunburst Dr
- 61430 Division St
- 7217 Sunny Vista Rd
- 61480 Division St
- 7199 Olympic Rd
- 61493 Desert Air Rd
- 60828 Division St
- 6607 San Angelo Ave
- 6607 Torres Ave
- 60787 Division St
- 60798 Division St
- 6623 San Angelo Ave
- 6640 San Angelo Ave
- 6763 Torres Ave
- 6657 Torres Ave
- 6641 San Angelo Ave
- 6656 San Angelo Ave
- 6657 San Angelo Ave
- 6153539 Division St
- 6671 Torres Ave
- 6671 San Angelo Ave
- 6688 San Angelo Ave
- 0 Division St Unit JT18158318
- 0 Division St Unit JT17255501
- 0 Division St Unit DC21127926
- 0 Division St Unit DC21131114
Your Personal Tour Guide
Ask me questions while you tour the home.