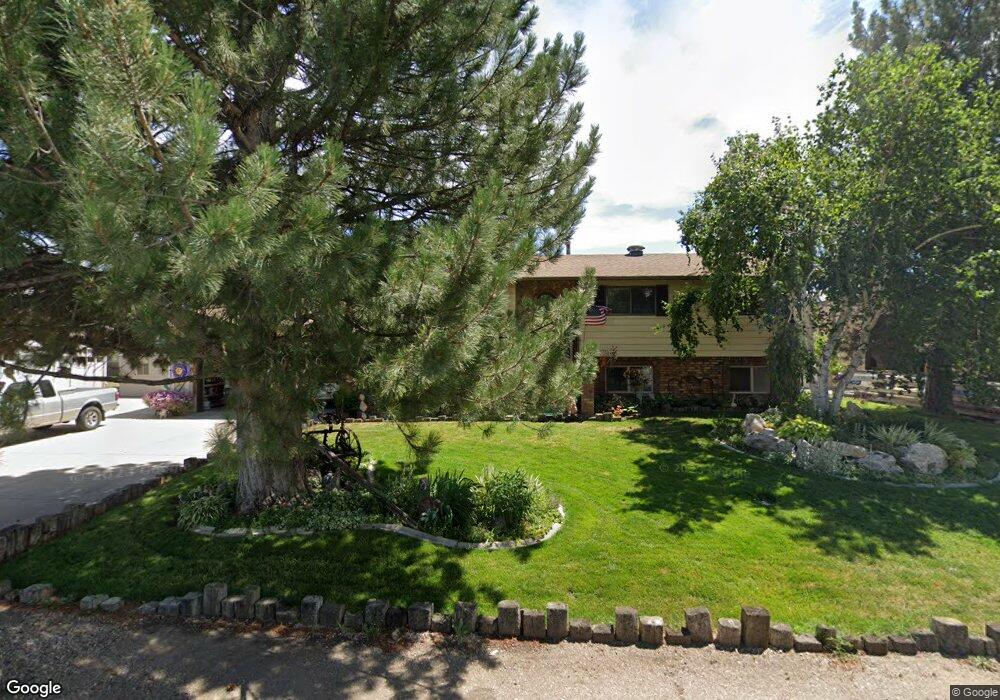
6089 W 5050 S Hooper, UT 84315
Estimated Value: $580,000 - $673,000
5
Beds
2
Baths
1,318
Sq Ft
$473/Sq Ft
Est. Value
About This Home
This home is located at 6089 W 5050 S, Hooper, UT 84315 and is currently estimated at $623,663, approximately $473 per square foot. 6089 W 5050 S is a home located in Weber County with nearby schools including Hooper Elementary School, Rocky Mountain Junior High School, and Fremont High School.
Ownership History
Date
Name
Owned For
Owner Type
Purchase Details
Closed on
May 5, 2025
Sold by
Rogers David J and Rogers Wendy S
Bought by
David And Wendy Rogers Family Trust and Rogers
Current Estimated Value
Purchase Details
Closed on
Mar 9, 2021
Sold by
Rogers David J and Rogers Wendy S
Bought by
Rogers David J and Rogers Wendy S
Home Financials for this Owner
Home Financials are based on the most recent Mortgage that was taken out on this home.
Original Mortgage
$108,200
Interest Rate
2.7%
Mortgage Type
New Conventional
Purchase Details
Closed on
Oct 24, 2016
Bought by
Rogers David J
Home Financials for this Owner
Home Financials are based on the most recent Mortgage that was taken out on this home.
Original Mortgage
$113,800
Interest Rate
3.52%
Purchase Details
Closed on
Jan 8, 2003
Sold by
Rogers David Jae and Rogers Wendy S
Bought by
Rogers Wendy and Rogers David
Home Financials for this Owner
Home Financials are based on the most recent Mortgage that was taken out on this home.
Original Mortgage
$140,000
Interest Rate
6.06%
Create a Home Valuation Report for This Property
The Home Valuation Report is an in-depth analysis detailing your home's value as well as a comparison with similar homes in the area
Home Values in the Area
Average Home Value in this Area
Purchase History
| Date | Buyer | Sale Price | Title Company |
|---|---|---|---|
| David And Wendy Rogers Family Trust | -- | None Listed On Document | |
| Rogers David J | -- | Us Title Insurance Agency | |
| Rogers David J | -- | -- | |
| Rogers Wendy | -- | Mountain View Title |
Source: Public Records
Mortgage History
| Date | Status | Borrower | Loan Amount |
|---|---|---|---|
| Previous Owner | Rogers David J | $108,200 | |
| Previous Owner | Rogers David J | $113,800 | |
| Previous Owner | Rogers David J | -- | |
| Previous Owner | Rogers Wendy | $140,000 |
Source: Public Records
Tax History Compared to Growth
Tax History
| Year | Tax Paid | Tax Assessment Tax Assessment Total Assessment is a certain percentage of the fair market value that is determined by local assessors to be the total taxable value of land and additions on the property. | Land | Improvement |
|---|---|---|---|---|
| 2025 | $3,344 | $552,739 | $183,965 | $368,774 |
| 2024 | $3,129 | $305,587 | $102,980 | $202,607 |
| 2023 | $3,194 | $309,127 | $101,502 | $207,625 |
| 2022 | $3,091 | $297,550 | $83,876 | $213,674 |
| 2021 | $2,580 | $416,999 | $117,000 | $299,999 |
| 2020 | $2,446 | $361,000 | $82,000 | $279,000 |
| 2019 | $2,322 | $324,999 | $62,064 | $262,935 |
| 2018 | $2,089 | $280,000 | $57,037 | $222,963 |
| 2017 | $1,903 | $245,999 | $56,531 | $189,468 |
| 2016 | $1,762 | $127,344 | $30,100 | $97,244 |
| 2015 | $1,670 | $118,911 | $26,298 | $92,613 |
| 2014 | $1,631 | $104,542 | $31,750 | $72,792 |
Source: Public Records
Map
Nearby Homes
- 6014 W 5300 S
- 6036 W 4700 S
- 5947 W 4600 S
- 0 W 5500 S
- 3729 S 5600 W Unit 6
- 3720 S 5600 W Unit 2
- 3719 S 5600 W Unit 7
- 4146 S 5800 W Unit 5
- 4163 S 5800 W Unit 2
- 5335 W 5500 S
- 3632 S 5400 W
- 4879 S 5050 W
- 5319 S 7100 W
- 4111 S 5350 W
- 3191 S 5100 St W Unit 1
- 5752 W 2425 N
- 5801 S 7100 W
- 3706 S 5650 W Unit 9
- 4931 S 4700 W
- 3691 S 5600 W Unit 20
- 6086 W 5050 S
- 6067 W 5050 S
- 6107 W 5050 S
- 6064 W 5050 S
- 6043 W 5050 S
- 6104 W 5050 S
- 6122 W 5050 S
- 6040 W 5050 S
- 6025 W 5050 S
- 5082 S 6150 W
- 6022 W 5050 S
- 5070 S 6150 W
- 4986 S 6150 W
- 5300 W 5100 S Unit 7
- 5300 W 5100 S Unit 4-R
- 5300 W 5100 S Unit 8
- 5300 W 5100 S Unit 3-R
- 5300 W 5100 S Unit 5-R
- 5500 W 5100 S Unit 4
- 5500 W 5100 S Unit 2