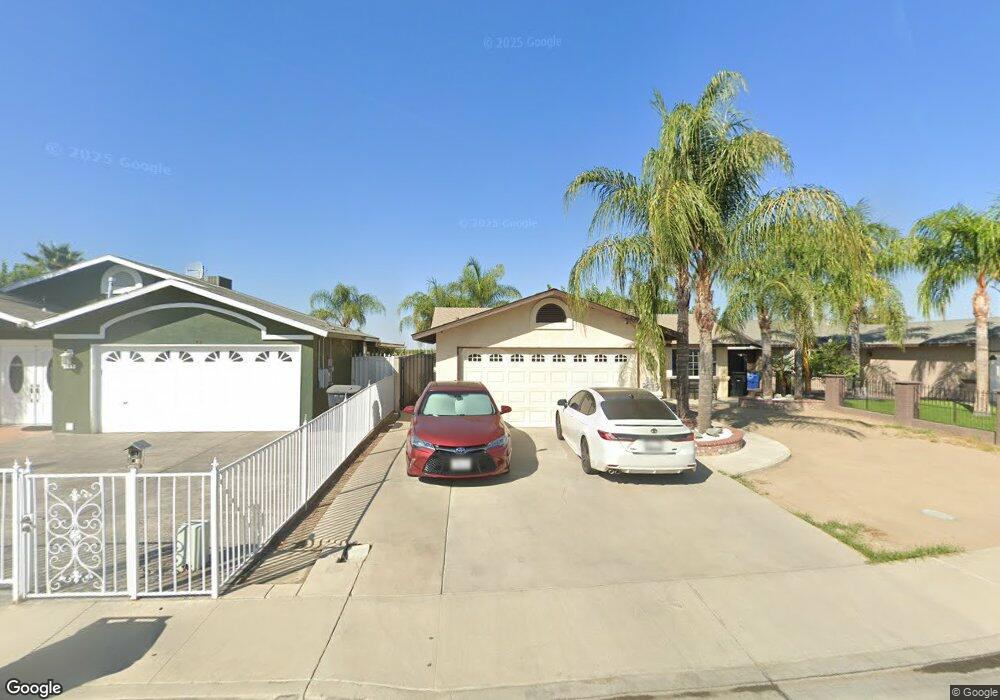
609 11th St Mc Farland, CA 93250
Estimated Value: $255,000 - $305,000
3
Beds
2
Baths
1,097
Sq Ft
$253/Sq Ft
Est. Value
About This Home
This home is located at 609 11th St, Mc Farland, CA 93250 and is currently estimated at $278,032, approximately $253 per square foot. 609 11th St is a home located in Kern County with nearby schools including McFarland High School.
Ownership History
Date
Name
Owned For
Owner Type
Purchase Details
Closed on
Apr 21, 2006
Sold by
Lopez Mario C
Bought by
Lopez Mario C and Lopez Emma G
Current Estimated Value
Home Financials for this Owner
Home Financials are based on the most recent Mortgage that was taken out on this home.
Original Mortgage
$150,000
Outstanding Balance
$85,851
Interest Rate
6.29%
Mortgage Type
Fannie Mae Freddie Mac
Estimated Equity
$192,181
Purchase Details
Closed on
Nov 10, 1998
Sold by
4 H Development Inc
Bought by
Lopez Mario C and Lopez Emma G
Home Financials for this Owner
Home Financials are based on the most recent Mortgage that was taken out on this home.
Original Mortgage
$77,500
Interest Rate
6.54%
Create a Home Valuation Report for This Property
The Home Valuation Report is an in-depth analysis detailing your home's value as well as a comparison with similar homes in the area
Home Values in the Area
Average Home Value in this Area
Purchase History
| Date | Buyer | Sale Price | Title Company |
|---|---|---|---|
| Lopez Mario C | -- | Accommodation | |
| Lopez Mario C | -- | Ticor Title | |
| Lopez Mario C | $77,500 | American Title Co |
Source: Public Records
Mortgage History
| Date | Status | Borrower | Loan Amount |
|---|---|---|---|
| Open | Lopez Mario C | $150,000 | |
| Closed | Lopez Mario C | $77,500 |
Source: Public Records
Tax History Compared to Growth
Tax History
| Year | Tax Paid | Tax Assessment Tax Assessment Total Assessment is a certain percentage of the fair market value that is determined by local assessors to be the total taxable value of land and additions on the property. | Land | Improvement |
|---|---|---|---|---|
| 2025 | $1,483 | $121,473 | $31,340 | $90,133 |
| 2024 | $1,456 | $119,092 | $30,726 | $88,366 |
| 2023 | $1,456 | $116,758 | $30,124 | $86,634 |
| 2022 | $1,418 | $114,470 | $29,534 | $84,936 |
| 2021 | $1,347 | $112,226 | $28,955 | $83,271 |
| 2020 | $1,299 | $111,077 | $28,659 | $82,418 |
| 2019 | $1,225 | $111,077 | $28,659 | $82,418 |
| 2018 | $1,209 | $106,766 | $27,548 | $79,218 |
| 2017 | $1,177 | $104,673 | $27,008 | $77,665 |
| 2016 | $1,160 | $102,622 | $26,479 | $76,143 |
| 2015 | $1,138 | $101,082 | $26,082 | $75,000 |
| 2014 | $1,090 | $99,103 | $25,572 | $73,531 |
Source: Public Records
Map
Nearby Homes
- 539 11th St
- 733 Ensenata Dr
- 450 8th St
- 314 8th St
- 0 W Sherwood Ave Unit 202506495
- 0 W Sherwood Ave Unit 21453658
- 830 Davis Ave
- 249 Robertson Ave
- 124 4th Place
- 737 Misty Ave
- 13271 Garzoli Ave
- 30787 Perkins Ave
- Floorplan 2000 AP at Tierra Del Sol
- Floorplan 1700 at Tierra Del Sol
- Floorplan 1810 at Tierra Del Sol
- Floorplan 1523 at Tierra Del Sol
- Floorplan 1320 at Tierra Del Sol
- Floorplan 1275 at Tierra Del Sol
- 276 San Juan St
- 583 Taylor Ave