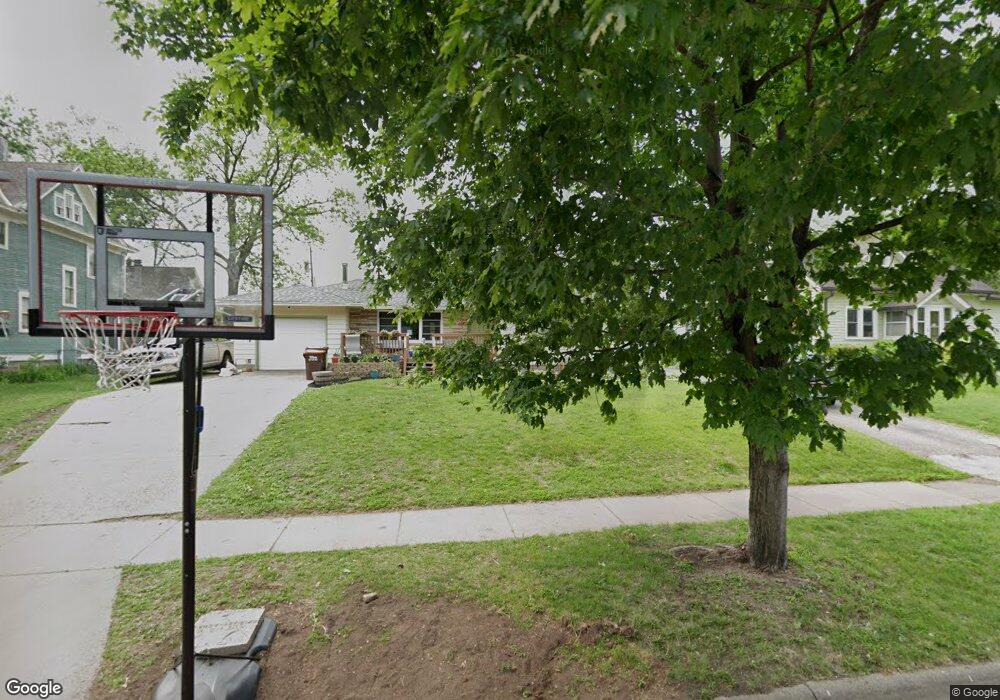
609 7th St W Hastings, MN 55033
Hastings-Marshan Township NeighborhoodEstimated Value: $318,000 - $385,000
3
Beds
2
Baths
2,568
Sq Ft
$135/Sq Ft
Est. Value
About This Home
This home is located at 609 7th St W, Hastings, MN 55033 and is currently estimated at $345,419, approximately $134 per square foot. 609 7th St W is a home located in Dakota County with nearby schools including Hastings Middle School, Christa Mcauliffe Elementary School, and Hastings High School.
Ownership History
Date
Name
Owned For
Owner Type
Purchase Details
Closed on
Feb 22, 2019
Sold by
Wittkopf Berniece
Bought by
Kaesemacher Eric and Kaesemacher Samatha
Current Estimated Value
Home Financials for this Owner
Home Financials are based on the most recent Mortgage that was taken out on this home.
Original Mortgage
$196,278
Outstanding Balance
$78,682
Interest Rate
4.4%
Mortgage Type
Stand Alone Second
Estimated Equity
$266,737
Create a Home Valuation Report for This Property
The Home Valuation Report is an in-depth analysis detailing your home's value as well as a comparison with similar homes in the area
Home Values in the Area
Average Home Value in this Area
Purchase History
| Date | Buyer | Sale Price | Title Company |
|---|---|---|---|
| Kaesemacher Eric | $199,900 | Edina Realty Title Inc |
Source: Public Records
Mortgage History
| Date | Status | Borrower | Loan Amount |
|---|---|---|---|
| Open | Kaesemacher Eric | $196,278 | |
| Closed | Kaesemacher Eric | $196,278 |
Source: Public Records
Tax History Compared to Growth
Tax History
| Year | Tax Paid | Tax Assessment Tax Assessment Total Assessment is a certain percentage of the fair market value that is determined by local assessors to be the total taxable value of land and additions on the property. | Land | Improvement |
|---|---|---|---|---|
| 2024 | $3,650 | $323,300 | $62,700 | $260,600 |
| 2023 | $3,650 | $322,700 | $62,800 | $259,900 |
| 2022 | $3,056 | $318,400 | $62,700 | $255,700 |
| 2021 | $2,948 | $259,600 | $54,500 | $205,100 |
| 2020 | $2,998 | $249,800 | $51,900 | $197,900 |
| 2019 | $2,923 | $245,900 | $49,400 | $196,500 |
| 2018 | $2,684 | $229,500 | $47,100 | $182,400 |
| 2017 | $2,333 | $206,700 | $44,800 | $161,900 |
| 2016 | $2,335 | $182,900 | $41,900 | $141,000 |
| 2015 | $2,246 | $157,870 | $35,896 | $121,974 |
| 2014 | -- | $152,638 | $34,348 | $118,290 |
| 2013 | -- | $126,260 | $29,797 | $96,463 |
Source: Public Records
Map
Nearby Homes