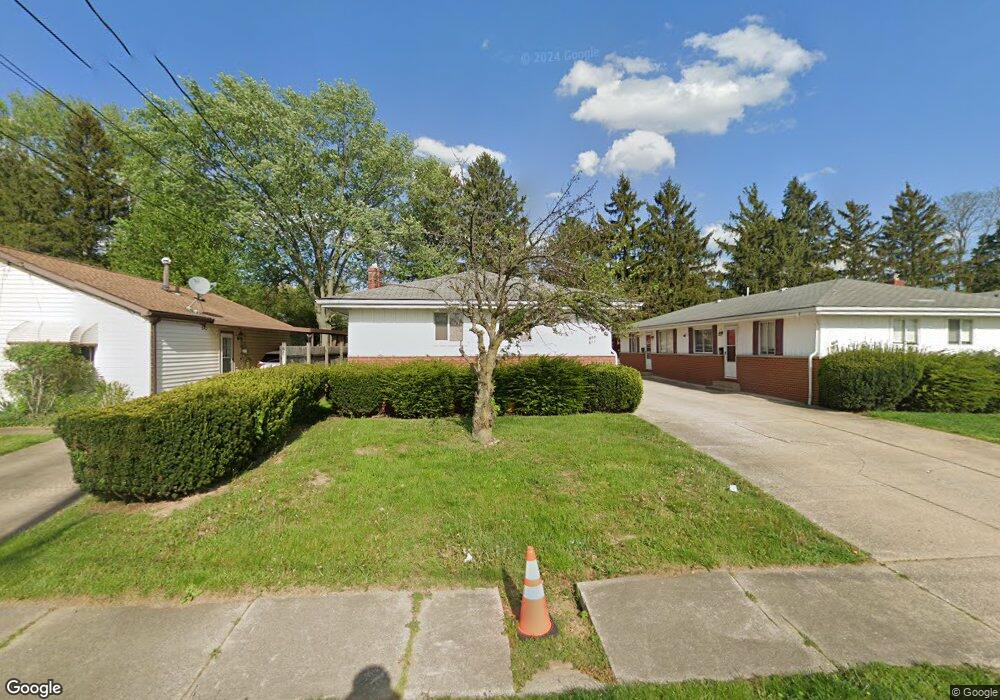
609 Baldwin Rd Unit 611 Akron, OH 44312
Ellet NeighborhoodEstimated Value: $163,000 - $1,004,554
4
Beds
2
Baths
1,440
Sq Ft
$266/Sq Ft
Est. Value
About This Home
This home is located at 609 Baldwin Rd Unit 611, Akron, OH 44312 and is currently estimated at $382,889, approximately $265 per square foot. 609 Baldwin Rd Unit 611 is a home located in Summit County with nearby schools including Ellet High School, Summit Academy Akron Elementary School, and Eagle Elementary.
Ownership History
Date
Name
Owned For
Owner Type
Purchase Details
Closed on
Mar 26, 2014
Sold by
Bayside Investment Group Llc
Bought by
Bowers Keith
Current Estimated Value
Purchase Details
Closed on
Mar 31, 1999
Sold by
Michelle Mellon D Todd Mazzagatti Mellon
Bought by
Bayside Investment Group Ltd
Home Financials for this Owner
Home Financials are based on the most recent Mortgage that was taken out on this home.
Original Mortgage
$814,400
Interest Rate
6.89%
Mortgage Type
Purchase Money Mortgage
Purchase Details
Closed on
Jan 31, 1997
Sold by
Albert R School
Bought by
Mellon Todd D and Mellon Michelle
Home Financials for this Owner
Home Financials are based on the most recent Mortgage that was taken out on this home.
Original Mortgage
$68,000
Interest Rate
7.63%
Mortgage Type
New Conventional
Create a Home Valuation Report for This Property
The Home Valuation Report is an in-depth analysis detailing your home's value as well as a comparison with similar homes in the area
Home Values in the Area
Average Home Value in this Area
Purchase History
| Date | Buyer | Sale Price | Title Company |
|---|---|---|---|
| Bowers Keith | $725,941 | None Available | |
| Bayside Investment Group Ltd | -- | Northeast Title Agency Inc | |
| Mellon Todd D | $425,000 | -- |
Source: Public Records
Mortgage History
| Date | Status | Borrower | Loan Amount |
|---|---|---|---|
| Closed | Bayside Investment Group Ltd | $814,400 | |
| Previous Owner | Mellon Todd D | $68,000 | |
| Closed | Bowers Keith | $0 |
Source: Public Records
Tax History
| Year | Tax Paid | Tax Assessment Tax Assessment Total Assessment is a certain percentage of the fair market value that is determined by local assessors to be the total taxable value of land and additions on the property. | Land | Improvement |
|---|---|---|---|---|
| 2025 | $3,966 | $48,448 | $9,923 | $38,525 |
| 2024 | $2,610 | $48,448 | $9,923 | $38,525 |
| 2023 | $3,966 | $48,448 | $9,923 | $38,525 |
| 2022 | $2,464 | $35,886 | $7,350 | $28,536 |
| 2021 | $2,466 | $35,886 | $7,350 | $28,536 |
| 2020 | $2,430 | $35,890 | $7,350 | $28,540 |
| 2019 | $2,277 | $30,500 | $6,980 | $23,520 |
| 2018 | $2,247 | $30,500 | $6,980 | $23,520 |
| 2017 | $2,469 | $30,500 | $6,980 | $23,520 |
| 2016 | $2,420 | $32,360 | $6,980 | $25,380 |
| 2015 | $2,469 | $32,360 | $6,980 | $25,380 |
| 2014 | $2,449 | $32,360 | $6,980 | $25,380 |
| 2013 | $1,968 | $26,250 | $6,980 | $19,270 |
Source: Public Records
Map
Nearby Homes
- 1863 Harding Ave
- 581 Stanley Rd
- 472 Stephens Rd
- 1628 Merrill Ave
- 577 Essex St
- 1622 Merrill Ave Unit 1624
- 487 Hilbish Ave
- 1832 Springfield Center Rd
- 2138 Forest Oak Dr
- 274 Fulmer Ave
- 2226 Quayle Dr
- 2077 Coleman Ave
- 2199 Kelty Ct Unit 29
- 640 Plainfield Rd
- 260 Prairie Dr
- 111 Akers Ave
- 805 Utica Ave
- 529 Anderson Ave
- 2323 Mingo Trail
- 2511 Ogden Ave
- 611 Baldwin Rd
- 605 Baldwin Rd
- 613 Baldwin Rd
- 603 Baldwin Rd
- 617 Baldwin Rd Unit 619
- 601 Baldwin Rd Unit 603
- 601 Baldwin Rd
- 601 603 Baldwin Rd
- 623 Baldwin Rd
- 599 Baldwin Rd
- 621 Baldwin Rd
- 597 Baldwin Rd Unit 599
- 620 Gibbs Rd
- 625 Baldwin Rd Unit 627
- 593 Baldwin Rd Unit 595
- 627 Baldwin Rd
- 628 Gibbs Rd
- 608 Baldwin Rd
- 612 Gibbs Rd
- 595 Baldwin Rd
Your Personal Tour Guide
Ask me questions while you tour the home.