Estimated Value: $232,217 - $274,000
3
Beds
2
Baths
970
Sq Ft
$265/Sq Ft
Est. Value
About This Home
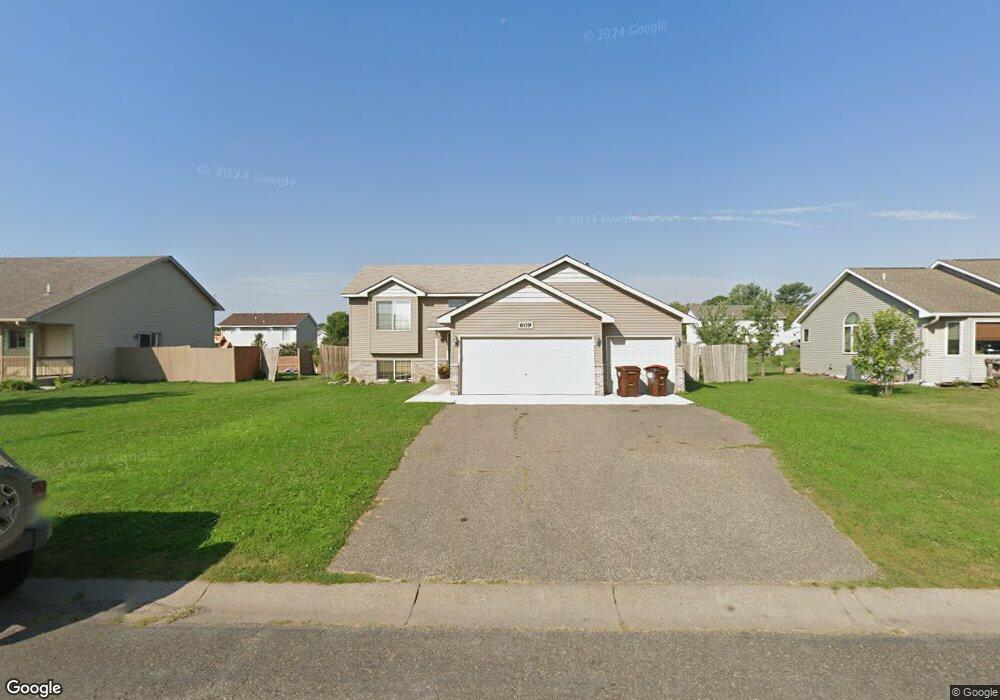
This home is located at 609 Bluebird St, Mora, MN 55051 and is currently estimated at $257,054, approximately $265 per square foot. 609 Bluebird St is a home located in Kanabec County with nearby schools including Fairview Elementary School, Mora Elementary School, and Mora Secondary School.
Ownership History
Date
Name
Owned For
Owner Type
Purchase Details
Closed on
Apr 14, 2017
Sold by
Riggan Kelly and Riggan Sherri
Bought by
Johnson Andrew M and Johnson Makala R
Current Estimated Value
Home Financials for this Owner
Home Financials are based on the most recent Mortgage that was taken out on this home.
Original Mortgage
$144,747
Outstanding Balance
$120,087
Interest Rate
4.1%
Mortgage Type
New Conventional
Estimated Equity
$136,967
Purchase Details
Closed on
Jun 25, 2013
Sold by
Stone Financing Llc
Bought by
Riggan Kelly and Riggan Sherri
Purchase Details
Closed on
Apr 16, 2013
Sold by
Posthumus Sandra M and Posthumus Aaron M
Bought by
Stone Financing Llc
Purchase Details
Closed on
May 20, 2005
Sold by
Merit Development Co Inc
Bought by
Harwood Homes Ionc
Home Financials for this Owner
Home Financials are based on the most recent Mortgage that was taken out on this home.
Original Mortgage
$70,500
Interest Rate
5.91%
Mortgage Type
Construction
Create a Home Valuation Report for This Property
The Home Valuation Report is an in-depth analysis detailing your home's value as well as a comparison with similar homes in the area
Home Values in the Area
Average Home Value in this Area
Purchase History
| Date | Buyer | Sale Price | Title Company |
|---|---|---|---|
| Johnson Andrew M | $143,300 | East Central Title | |
| Riggan Kelly | $115,000 | Stewart Title Guaranty Co | |
| Stone Financing Llc | $115,000 | Stewart Title Guaranty Co | |
| Harwood Homes Ionc | $26,900 | First Integrity Title |
Source: Public Records
Mortgage History
| Date | Status | Borrower | Loan Amount |
|---|---|---|---|
| Open | Johnson Andrew M | $144,747 | |
| Previous Owner | Harwood Homes Ionc | $70,500 |
Source: Public Records
Tax History
| Year | Tax Paid | Tax Assessment Tax Assessment Total Assessment is a certain percentage of the fair market value that is determined by local assessors to be the total taxable value of land and additions on the property. | Land | Improvement |
|---|---|---|---|---|
| 2025 | $3,894 | $228,400 | $32,500 | $195,900 |
| 2024 | $3,804 | $248,300 | $32,500 | $215,800 |
| 2023 | $3,820 | $246,400 | $32,500 | $213,900 |
| 2022 | $3,472 | $232,200 | $30,500 | $201,700 |
| 2021 | $3,300 | $192,800 | $25,500 | $167,300 |
| 2020 | $2,824 | $184,300 | $25,500 | $158,800 |
| 2018 | $2,022 | $140,300 | $24,115 | $116,185 |
| 2017 | $2,294 | $106,900 | $19,407 | $87,493 |
| 2016 | $3,594 | $120,900 | $24,000 | $96,900 |
| 2015 | $1,510 | $112,000 | $20,000 | $92,000 |
| 2013 | $1,510 | $82,600 | $15,032 | $67,568 |
Source: Public Records
Map
Nearby Homes
- 412 Bluebird St
- 411 Bluebird St
- 409 Bluebird St
- 22-08053-0 Minnesota 23
- 22-08133-0 Minnesota 23
- 930 Highway 65 S
- 000 N Brook View Dr
- 212 Forest Ave W
- 523 Vasa Way
- 519 Vasa Way
- 515 Vasa Way
- 509 Vasa Way
- 702 Sunset Ln
- 505 Vasa Way
- 524 Vasa Way
- 520 Vasa Way
- 510 Vasa Way
- 748 Highway 65 N
- 504 Vasa Way
- 500 Vasa Way
- 609 609 Bluebird St
- 605 Bluebird St
- 605 605 Bluebird St
- 611 Bluebird St
- 611 Bluebird St
- 616 616 Bluebird St
- 612 612 Bluebird-Street-
- 608 608 Bluebird-Street-
- 601 601 Bluebird St
- 608 Bluebird St
- 601 Bluebird St
- 615 Bluebird St
- 606 Jewell St
- 612 Bluebird St
- 610 Jewell St
- 610 Jewell St
- 604 Bluebird St
- 600 Jewell St
- 614 Jewell St
- 600 600 Jewell St
Your Personal Tour Guide
Ask me questions while you tour the home.