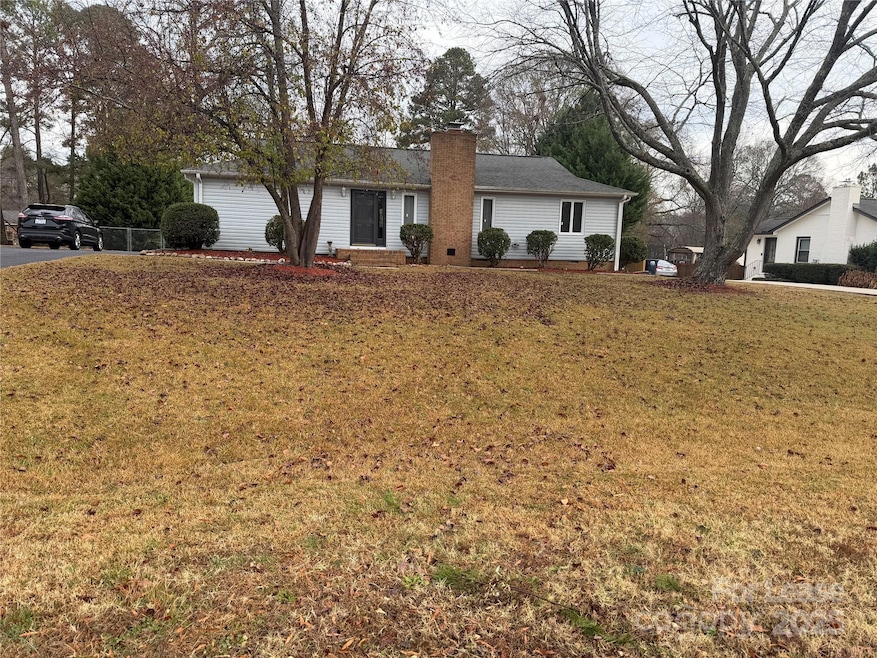
609 Catawba Cir N Matthews, NC 28104
Highlights
- No HOA
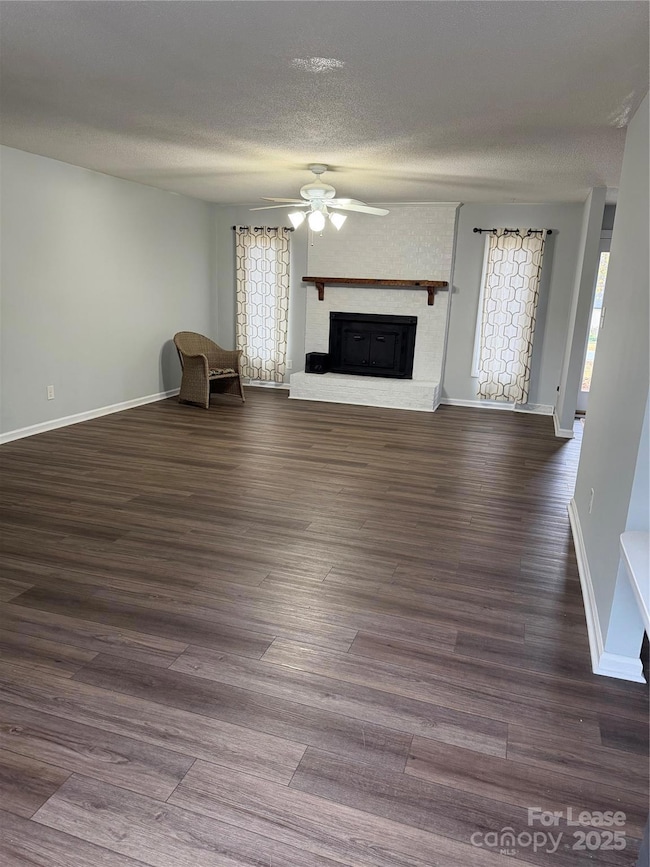
- Fireplace
- 1-Story Property
- Indian Trail Elementary School Rated A
- Laundry Room
- Fire Pit
About This Home
Prime Location – No HOA!
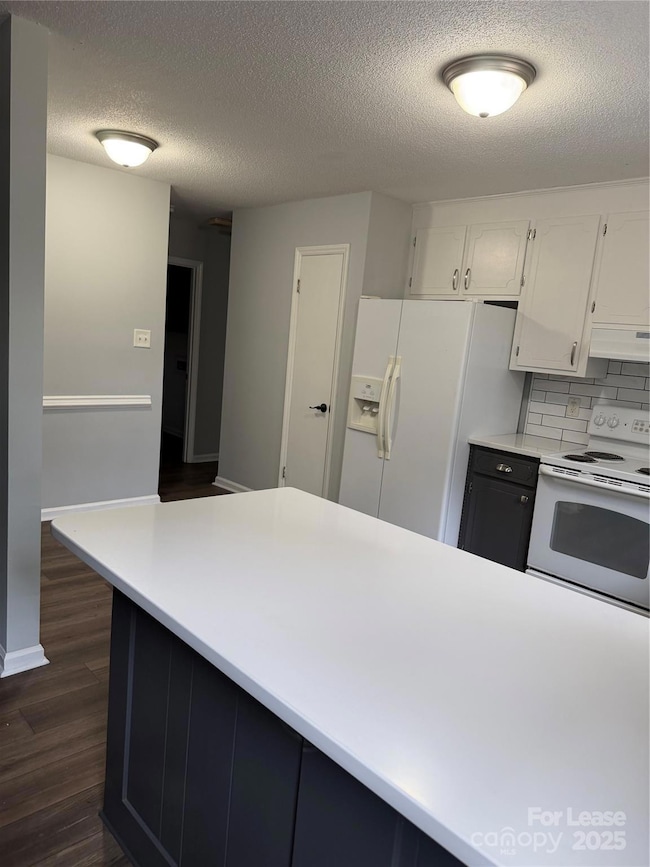
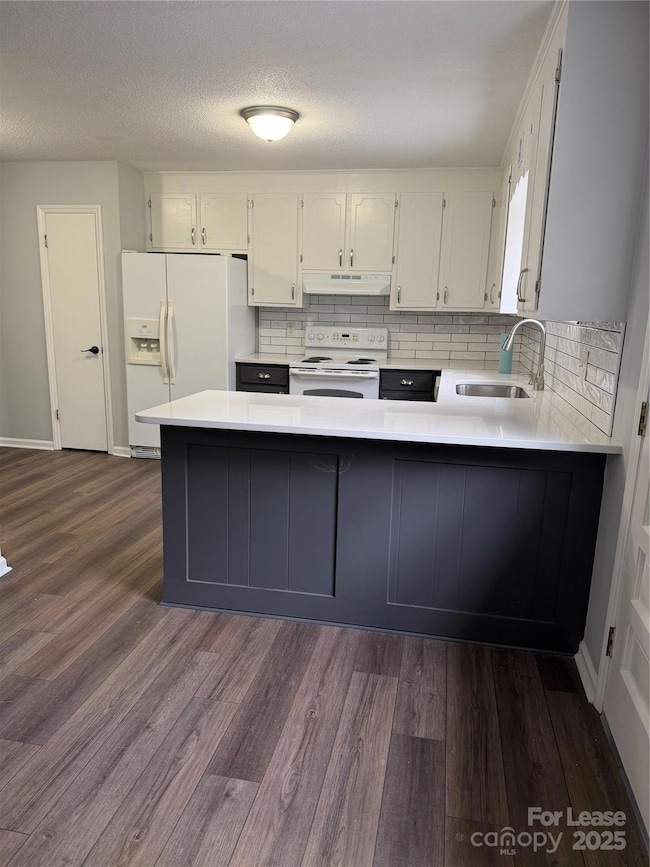
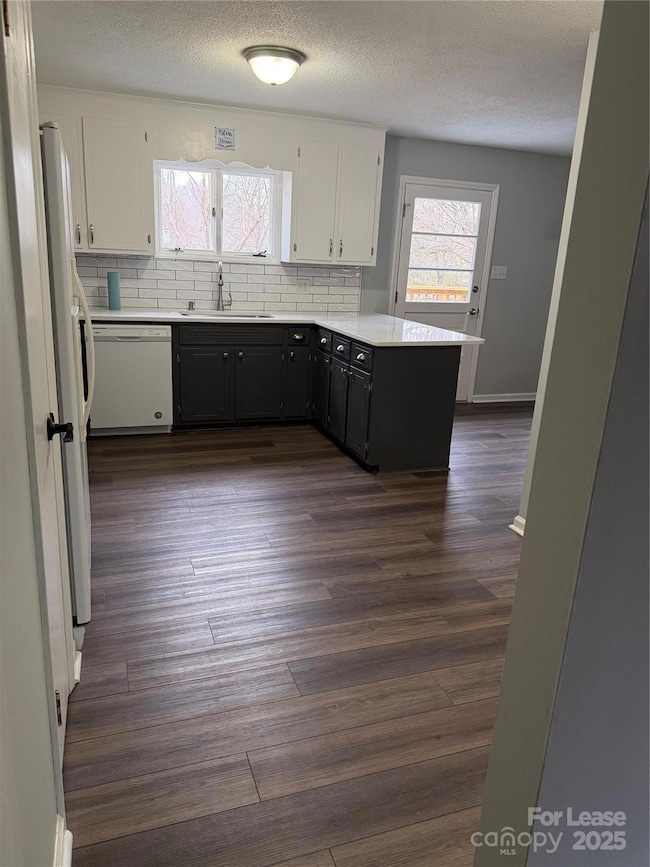
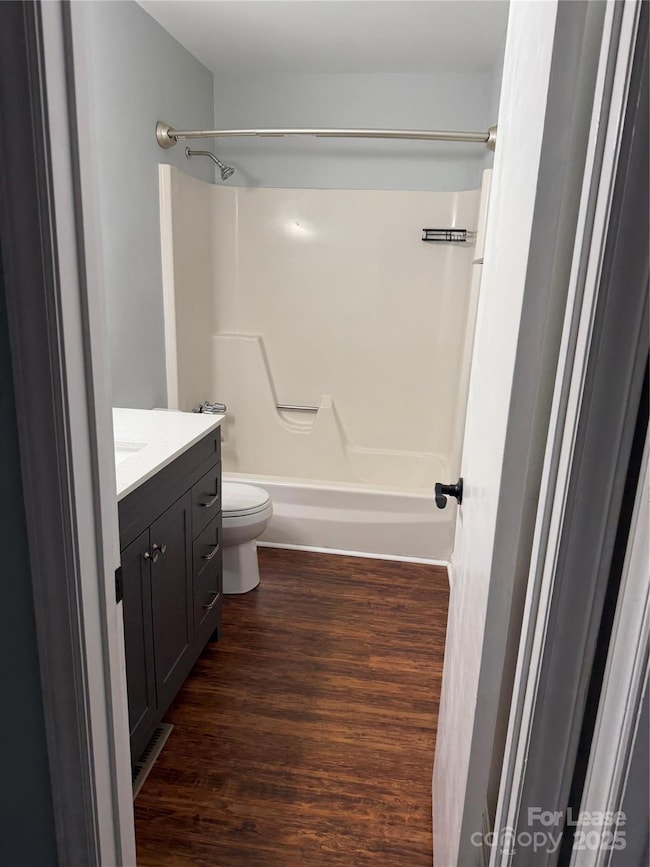
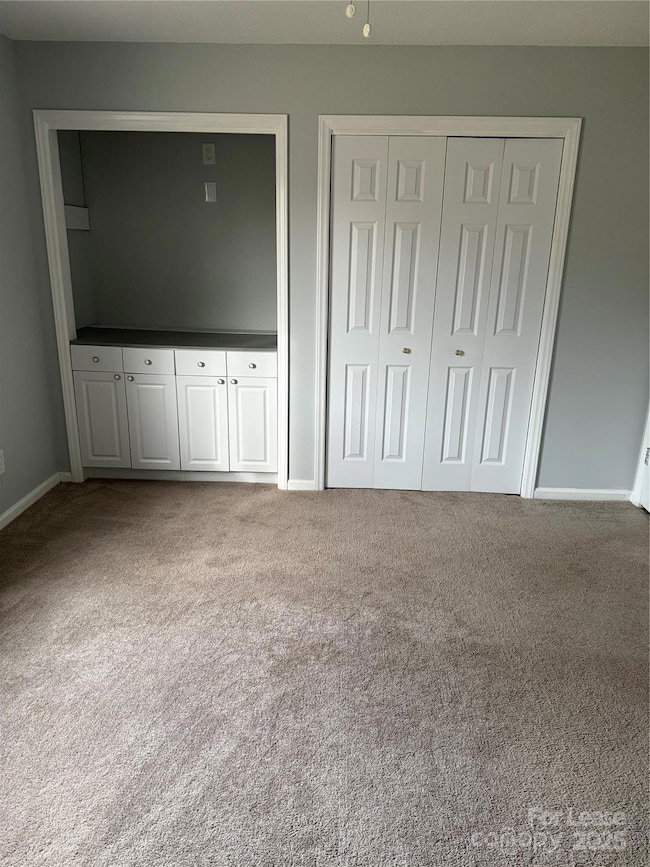
Well-maintained 3-bed, 2-bath home on a 1/2-acre lot with quick access to Downtown Matthews, HWY 74, and I-485. The split-bedroom layout features a spacious primary suite, open living area, and an updated secondary bathroom. The kitchen has been refreshed, and brand-new windows will be installed on 12/5. Step outside to a large deck overlooking a private, oversized backyard complete with a built-in fire pit — perfect for entertaining.
Listing Agent
EXP Realty LLC Ballantyne Brokerage Phone: 704-794-3407 License #341929 Listed on: 12/03/2025

Home Details
Home Type
- Single Family
Est. Annual Taxes
- $1,973
Year Built
- Built in 1977
Lot Details
- Back Yard Fenced
- Property is zoned AP4
Parking
- Driveway
Interior Spaces
- 1-Story Property
- Fireplace
- Crawl Space
- Pull Down Stairs to Attic
- Laundry Room
Bedrooms and Bathrooms
- 3 Main Level Bedrooms
- 2 Full Bathrooms
Outdoor Features
- Fire Pit
Community Details
- No Home Owners Association
- Cherokee Woods Subdivision
Listing and Financial Details
- Security Deposit $3,000
- Property Available on 12/3/25
- Assessor Parcel Number 07-129-485
Map
Source: Canopy MLS (Canopy Realtor® Association)
MLS Number: 4326772
APN: 07-129-485
Disclaimer: Certain information contained herein is derived from information provided by parties other than Homes.com. All information provided is deemed reliable, but is not guaranteed to be accurate and should be independently verified.
![]() Based on information submitted to the MLS GRID. All data is obtained from various sources and may not have been verified by broker or MLS GRID. Supplied Open House Information is subject to change without notice. All information should be independently reviewed and verified for accuracy. Properties may or may not be listed by the office/agent presenting the information. Some IDX listings have been excluded from this website.
Based on information submitted to the MLS GRID. All data is obtained from various sources and may not have been verified by broker or MLS GRID. Supplied Open House Information is subject to change without notice. All information should be independently reviewed and verified for accuracy. Properties may or may not be listed by the office/agent presenting the information. Some IDX listings have been excluded from this website.
The Digital Millennium Copyright Act of 1998, 17 U.S.C. § 512 (the “DMCA”) provides recourse for copyright owners who believe that material appearing on the Internet infringes their rights under U.S. copyright law. If you believe in good faith that any content or material made available in connection with our website or services infringes your copyright, you (or your agent) may send us a notice requesting that the content or material be removed, or access to it blocked.
Notices must be sent in writing by email to DMCAnotice@MLSGrid.com.
The DMCA requires that your notice of alleged copyright infringement include the following information:
(1) description of the copyrighted work that is the subject of claimed infringement;
(2) description of the alleged infringing content and information sufficient to permit us to locate the content;
(3) contact information for you, including your address, telephone number and email address;
(4) a statement by you that you have a good faith belief that the content in the manner complained of is not authorized by the copyright owner, or its agent, or by the operation of any law;
(5) a statement by you, signed under penalty of perjury, that the information in the notification is accurate and that you have the authority to enforce the copyrights that are claimed to be infringed; and
(6) a physical or electronic signature of the copyright owner or a person authorized to act on the copyright owner’s behalf. Failure to include all of the above information may result in the delay of the processing of your complaint.
- 724 Catawba Cir N
- 8025 Sheckler Ln
- 5000 Ashie Ave
- 6028 Zinnia Dr
- 00 Gribble Rd
- 407 Park Meadows Dr
- 318 Willow Wood Ct
- 5010 Poplar Glen Dr
- 8128 Sapwood Ct
- 0 Old Monroe Rd Unit 38 CAR4050924
- 348 Abington St
- 263 Harpers Run Ln
- 1000 Jessica Ln
- 230 Quinn Rd
- 226 Quinn Rd
- 0 Rhoderia Dr Unit 17 & 18
- 1202 Flowe Dr
- 210 Gribble Rd
- 185 Marron Dr
- 132 Greenbriar Dr
- 2206 Coatsdale Ln
- 2226 Coatsdale Ln
- 2017 Coatsdale Ln
- 4215 Suttle Place
- 206 Scenic View Ln
- 310 Willow Wood Ct
- 5072 Parkview Way
- 1019 Willowcroft Dr
- 118 Quinn Rd
- 135 Chestnut Ln
- 3114 Pine Pointe St
- 3740 Pleasant Plains Rd
- 336 Chestnut Pkwy
- 321 E Park Rd
- 1021 Glenn Valley Ln
- 1021 Glenn Valley Ln Unit 2A
- 1021 Glenn Valley Ln Unit 1A
- 1036 Tabard Ln
- 5230 Poplar Knoll Dr
- 1116 Sarandon Dr