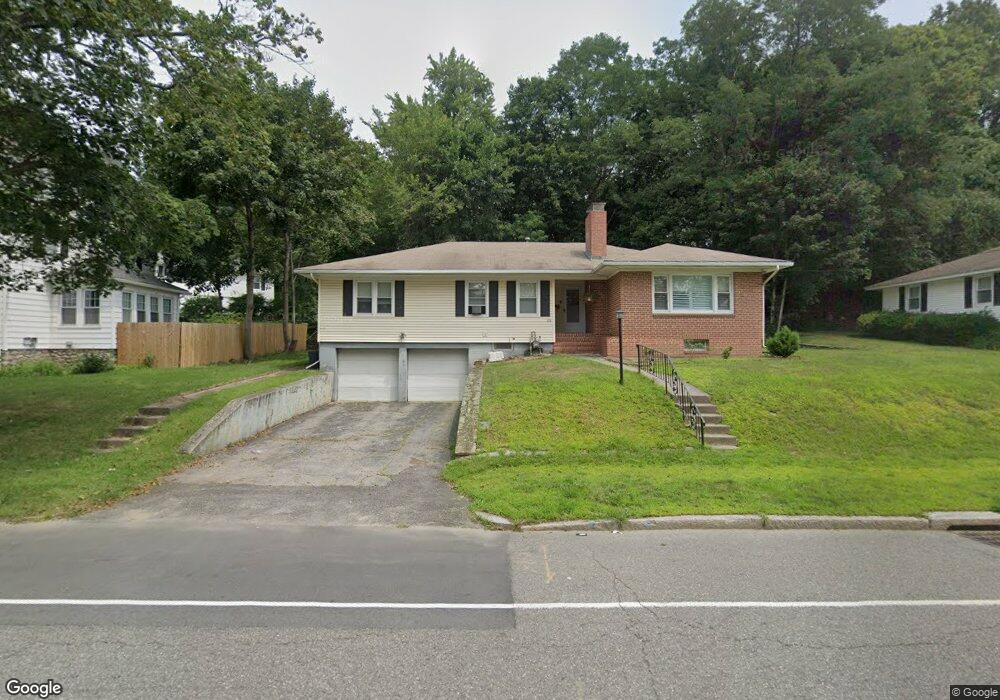
609 Chandler St Worcester, MA 01602
Tatnuck NeighborhoodEstimated Value: $453,081 - $497,000
3
Beds
2
Baths
1,709
Sq Ft
$274/Sq Ft
Est. Value
About This Home
This home is located at 609 Chandler St, Worcester, MA 01602 and is currently estimated at $467,770, approximately $273 per square foot. 609 Chandler St is a home located in Worcester County with nearby schools including Tatnuck Magnet School, Chandler Magnet, and Jacob Hiatt Magnet School.
Ownership History
Date
Name
Owned For
Owner Type
Purchase Details
Closed on
Jul 23, 2003
Sold by
Ha Trinh
Bought by
Ha Thanh C and Ha Trinh N
Current Estimated Value
Purchase Details
Closed on
Aug 14, 2002
Sold by
Hanson John F and Hanson Rose T
Bought by
Ha Trinh
Home Financials for this Owner
Home Financials are based on the most recent Mortgage that was taken out on this home.
Original Mortgage
$185,000
Interest Rate
6.61%
Mortgage Type
Purchase Money Mortgage
Purchase Details
Closed on
Aug 16, 1999
Sold by
Est Gallo Rose M and Ward Lois M
Bought by
Hanson John F and Hanson Rose T
Home Financials for this Owner
Home Financials are based on the most recent Mortgage that was taken out on this home.
Original Mortgage
$110,000
Interest Rate
7.65%
Mortgage Type
Purchase Money Mortgage
Create a Home Valuation Report for This Property
The Home Valuation Report is an in-depth analysis detailing your home's value as well as a comparison with similar homes in the area
Home Values in the Area
Average Home Value in this Area
Purchase History
| Date | Buyer | Sale Price | Title Company |
|---|---|---|---|
| Ha Thanh C | $232,000 | -- | |
| Ha Trinh | $232,000 | -- | |
| Hanson John F | $138,000 | -- |
Source: Public Records
Mortgage History
| Date | Status | Borrower | Loan Amount |
|---|---|---|---|
| Previous Owner | Hanson John F | $185,000 | |
| Previous Owner | Hanson John F | $60,000 | |
| Previous Owner | Hanson John F | $5,000 | |
| Previous Owner | Hanson John F | $110,000 |
Source: Public Records
Tax History
| Year | Tax Paid | Tax Assessment Tax Assessment Total Assessment is a certain percentage of the fair market value that is determined by local assessors to be the total taxable value of land and additions on the property. | Land | Improvement |
|---|---|---|---|---|
| 2025 | $5,205 | $394,600 | $118,300 | $276,300 |
| 2024 | $5,297 | $385,200 | $118,300 | $266,900 |
| 2023 | $5,137 | $358,200 | $102,900 | $255,300 |
| 2022 | $4,565 | $300,100 | $82,300 | $217,800 |
| 2021 | $4,609 | $283,100 | $65,900 | $217,200 |
| 2020 | $4,410 | $259,400 | $65,900 | $193,500 |
| 2019 | $4,144 | $230,200 | $59,300 | $170,900 |
| 2018 | $4,009 | $212,000 | $59,300 | $152,700 |
| 2017 | $4,075 | $212,000 | $59,300 | $152,700 |
| 2016 | $4,019 | $195,000 | $43,300 | $151,700 |
| 2015 | $3,914 | $195,000 | $43,300 | $151,700 |
| 2014 | $3,810 | $195,000 | $43,300 | $151,700 |
Source: Public Records
Map
Nearby Homes
- 12 Cardinal Rd
- 47R Yarnie Unit 3A
- 47R Yarnie Unit 1B
- 47R Yarnie Unit 2B
- 47R Yarnie Unit 4B
- 47R Yarnie Unit 8B
- 47R Yarnie Unit 5A
- 47R Yarnie Unit 6B
- 47R Yarnie Unit 4A
- 47R Yarnie Unit 1A
- 47R Yarnie Unit 9
- 47R Yarnie Unit 8A
- 47R Yarnie Unit 6A
- 47R Yarnie Unit 7A
- 47R Yarnie Unit 5B
- 47R Yarnie Unit 2A
- 47R Yarnie Unit 7B
- 23 Tiverton Pkwy
- 122 Copperfield Rd
- 118 Beaconsfield Rd
- 605 Chandler St
- 611 Chandler St
- 12 Annisquam St
- 8 Annisquam St
- 25 Willard Ave
- 603 Chandler St
- 606 Chandler St
- 604 Chandler St
- 27 Willard Ave
- 615 Chandler St
- 608 Chandler St
- 602 Chandler St
- 597 Chandler St
- 612 Chandler St
- 1 Atwater St
- 29 Willard Ave
- 7 Annisquam St
- 2 Atwater St
- 26 Willard Ave
- 5 Annisquam St
Your Personal Tour Guide
Ask me questions while you tour the home.