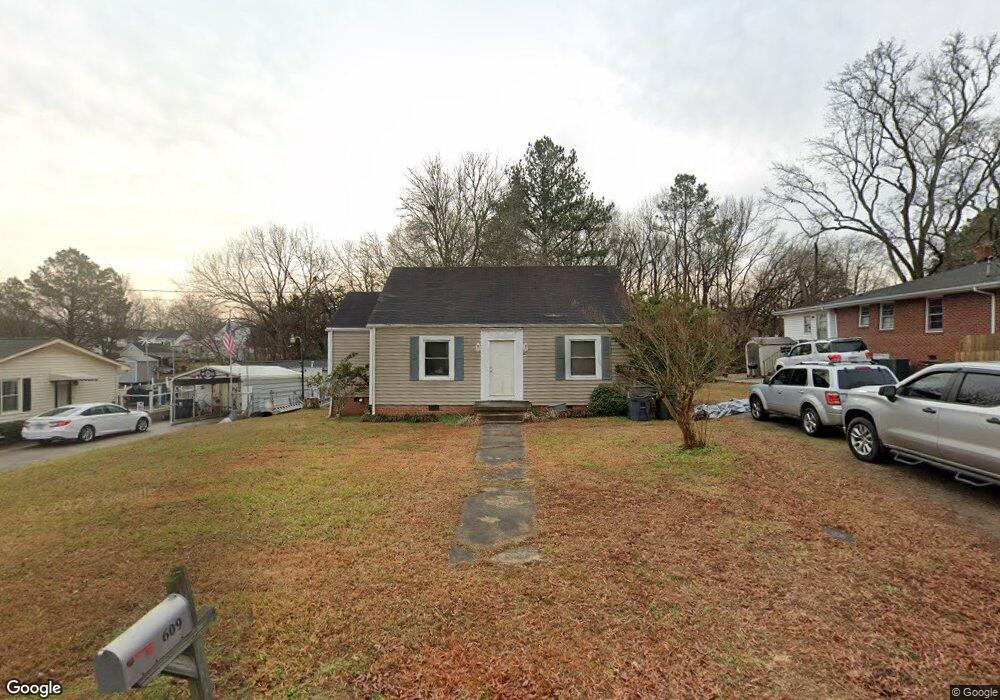
609 Cherry St Oxford, NC 27565
Estimated Value: $145,000 - $166,000
2
Beds
1
Bath
970
Sq Ft
$162/Sq Ft
Est. Value
About This Home
This home is located at 609 Cherry St, Oxford, NC 27565 and is currently estimated at $156,863, approximately $161 per square foot. 609 Cherry St is a home located in Granville County with nearby schools including West Oxford Elementary School, Northern Granville Middle School, and J.F. Webb High School.
Ownership History
Date
Name
Owned For
Owner Type
Purchase Details
Closed on
Jun 16, 2017
Sold by
Coletti Eugene and Coletti Kathleen Bennett
Bought by
Vanatta Mark
Current Estimated Value
Purchase Details
Closed on
Apr 29, 2014
Sold by
Patton Robert C and Patton Krystal Leigh
Bought by
Patton Robert C
Purchase Details
Closed on
Oct 10, 2008
Sold by
Wade Robert F and Wade Stacey M
Bought by
Patton Robert C and Patton Shelley W
Home Financials for this Owner
Home Financials are based on the most recent Mortgage that was taken out on this home.
Original Mortgage
$44,000
Interest Rate
5.78%
Mortgage Type
New Conventional
Purchase Details
Closed on
Sep 19, 2008
Sold by
Zimmerman Tracey H and Zimmerman Owen K
Bought by
Wade Robert F
Home Financials for this Owner
Home Financials are based on the most recent Mortgage that was taken out on this home.
Original Mortgage
$44,000
Interest Rate
5.78%
Mortgage Type
New Conventional
Create a Home Valuation Report for This Property
The Home Valuation Report is an in-depth analysis detailing your home's value as well as a comparison with similar homes in the area
Purchase History
| Date | Buyer | Sale Price | Title Company |
|---|---|---|---|
| Vanatta Mark | $66,000 | None Available | |
| Patton Robert C | -- | None Available | |
| Patton Robert C | $55,000 | -- | |
| Wade Robert F | -- | -- |
Source: Public Records
Mortgage History
| Date | Status | Borrower | Loan Amount |
|---|---|---|---|
| Previous Owner | Patton Robert C | $44,000 |
Source: Public Records
Tax History
| Year | Tax Paid | Tax Assessment Tax Assessment Total Assessment is a certain percentage of the fair market value that is determined by local assessors to be the total taxable value of land and additions on the property. | Land | Improvement |
|---|---|---|---|---|
| 2025 | $1,339 | $112,112 | $37,000 | $75,112 |
| 2024 | $1,339 | $112,112 | $37,000 | $75,112 |
| 2023 | $969 | $63,022 | $25,000 | $38,022 |
| 2022 | $958 | $63,022 | $25,000 | $38,022 |
| 2021 | $953 | $63,022 | $25,000 | $38,022 |
| 2020 | $953 | $63,022 | $25,000 | $38,022 |
| 2019 | $953 | $63,022 | $25,000 | $38,022 |
| 2018 | $953 | $63,022 | $25,000 | $38,022 |
| 2016 | $1,061 | $68,492 | $25,000 | $43,492 |
| 2015 | $1,022 | $68,492 | $25,000 | $43,492 |
| 2014 | $1,022 | $68,492 | $25,000 | $43,492 |
| 2013 | -- | $68,492 | $25,000 | $43,492 |
Source: Public Records
Map
Nearby Homes
- 511 Sunset Ave
- 109 Grace St
- 0 E Quail Ridge Rd Unit 10140609
- 308 Sunset Ave
- 204 & 206 Cardinal Ct
- 206 Cardinal Ct
- Lot 16 Dove Rd
- 14 & 15 Dove Rd
- 102 Bluegrass Dr
- 301 W Thorndale Dr
- 209 Broad St
- 0 Broad St
- 215 Keeneland Dr
- 311 Piedmont Ave
- 210 Orange St
- 103 Airdale Dr
- 105 Airdale Dr
- 101 Airdale Dr
- 405 Sycamore St
- 103 W Spring St
Your Personal Tour Guide
Ask me questions while you tour the home.