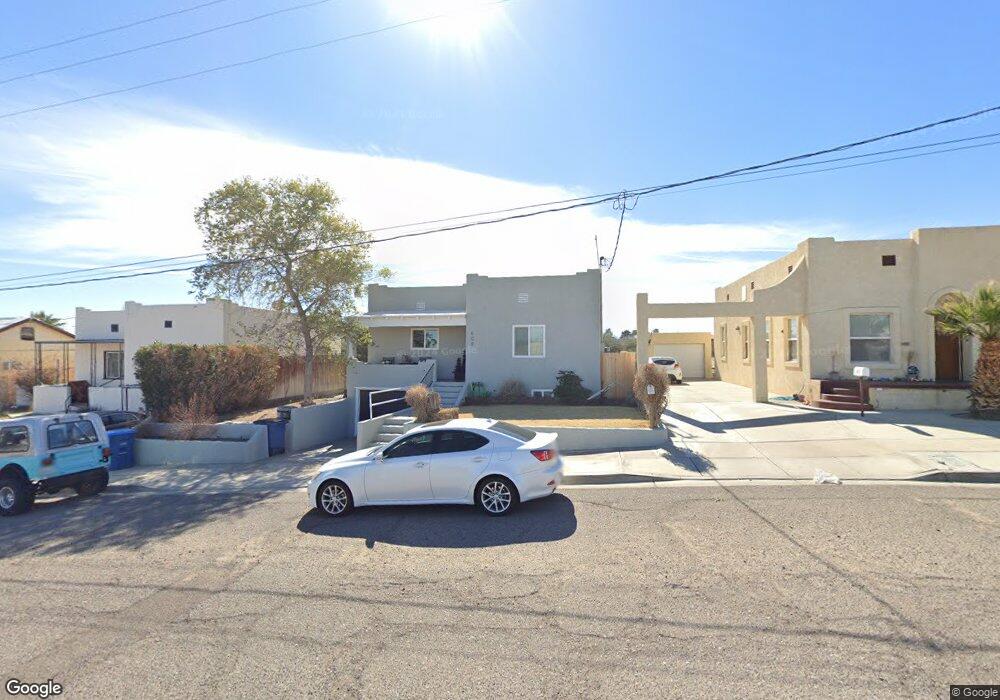
609 Cibola St Needles, CA 92363
Estimated Value: $87,702 - $178,000
3
Beds
2
Baths
1,424
Sq Ft
$94/Sq Ft
Est. Value
About This Home
This home is located at 609 Cibola St, Needles, CA 92363 and is currently estimated at $133,176, approximately $93 per square foot. 609 Cibola St is a home located in San Bernardino County with nearby schools including Vista Colorado Elementary School, Chemehuevi Valley Elementary School, and Needles Middle School.
Ownership History
Date
Name
Owned For
Owner Type
Purchase Details
Closed on
Jun 22, 2021
Sold by
Calderon Steven
Bought by
Calderon Jennifer Marie and Calderon Stevie Marie
Current Estimated Value
Purchase Details
Closed on
Oct 20, 1998
Sold by
Calderon Steve
Bought by
Calderon Steve
Home Financials for this Owner
Home Financials are based on the most recent Mortgage that was taken out on this home.
Original Mortgage
$21,000
Interest Rate
6.54%
Create a Home Valuation Report for This Property
The Home Valuation Report is an in-depth analysis detailing your home's value as well as a comparison with similar homes in the area
Home Values in the Area
Average Home Value in this Area
Purchase History
| Date | Buyer | Sale Price | Title Company |
|---|---|---|---|
| Calderon Jennifer Marie | -- | None Available | |
| Calderon Steve | -- | Commonwealth Land Title Co |
Source: Public Records
Mortgage History
| Date | Status | Borrower | Loan Amount |
|---|---|---|---|
| Closed | Calderon Steve | $21,000 |
Source: Public Records
Tax History
| Year | Tax Paid | Tax Assessment Tax Assessment Total Assessment is a certain percentage of the fair market value that is determined by local assessors to be the total taxable value of land and additions on the property. | Land | Improvement |
|---|---|---|---|---|
| 2025 | $719 | $56,630 | $6,796 | $49,834 |
| 2024 | $705 | $55,520 | $6,663 | $48,857 |
| 2023 | $773 | $54,431 | $6,532 | $47,899 |
| 2022 | $930 | $67,482 | $13,402 | $54,080 |
| 2021 | $740 | $52,295 | $6,275 | $46,020 |
| 2020 | $733 | $51,759 | $6,211 | $45,548 |
| 2019 | $735 | $50,744 | $6,089 | $44,655 |
| 2018 | $732 | $49,749 | $5,970 | $43,779 |
| 2017 | $710 | $48,774 | $5,853 | $42,921 |
| 2016 | $645 | $47,817 | $5,738 | $42,079 |
| 2015 | $528 | $47,099 | $5,652 | $41,447 |
| 2014 | $476 | $46,176 | $5,541 | $40,635 |
Source: Public Records
Map
Nearby Homes
- 521 Desnok St
- 401 Cibola St
- 406 D St
- 419 Acoma St
- 222 C St
- 310 D St
- 516 Palm Way
- 219 Cibola St
- 215 Cibola St
- 156 A St Unit 156
- 608 W Broadway St
- 520 Quivera St
- 0 Vacant Land Unit JT26035819
- 0 N A Unit S701893
- 521 Quivera St
- 115 E St
- 1200 Lillyhill Dr
- 196 Thunderhead 2
- 40 W Broadway St
- 1330 Santa fe Cir
Your Personal Tour Guide
Ask me questions while you tour the home.