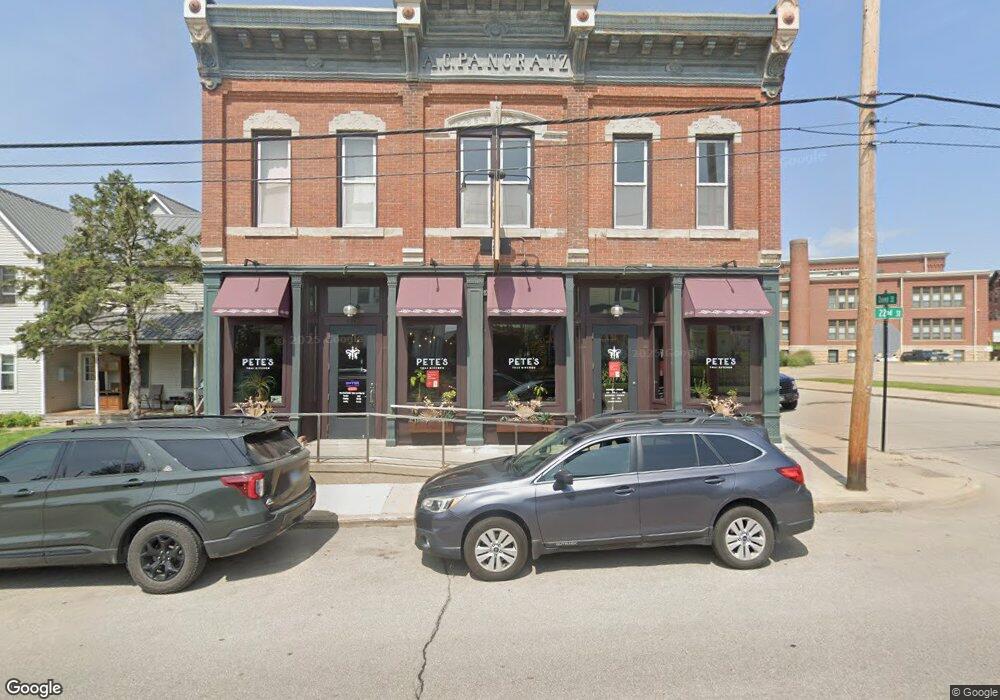
609 E 22nd St Dubuque, IA 52001
Estimated Value: $162,409
Studio
--
Bath
6,240
Sq Ft
$26/Sq Ft
Est. Value
About This Home
This home is located at 609 E 22nd St, Dubuque, IA 52001 and is currently priced at $162,409, approximately $26 per square foot. 609 E 22nd St is a home located in Dubuque County with nearby schools including Audubon Elementary School, Thomas Jefferson Middle School, and Hempstead High School.
Ownership History
Date
Name
Owned For
Owner Type
Purchase Details
Closed on
Nov 17, 2017
Sold by
K-Kids Llc
Bought by
All In Properties Llc
Current Estimated Value
Purchase Details
Closed on
May 24, 2013
Sold by
Heritage Assets Llc
Bought by
K-Kids Llc
Home Financials for this Owner
Home Financials are based on the most recent Mortgage that was taken out on this home.
Original Mortgage
$60,000
Outstanding Balance
$42,325
Interest Rate
3.38%
Mortgage Type
New Conventional
Purchase Details
Closed on
Dec 2, 2009
Sold by
Wheelock Paul A
Bought by
Heritage Assets Llc
Purchase Details
Closed on
Apr 30, 2008
Sold by
Esser Robert L and Esser Deborah J
Bought by
Wheelock Paul A
Home Financials for this Owner
Home Financials are based on the most recent Mortgage that was taken out on this home.
Original Mortgage
$141,100
Interest Rate
5.88%
Mortgage Type
Commercial
Create a Home Valuation Report for This Property
The Home Valuation Report is an in-depth analysis detailing your home's value as well as a comparison with similar homes in the area
Purchase History
| Date | Buyer | Sale Price | Title Company |
|---|---|---|---|
| All In Properties Llc | -- | None Available | |
| K-Kids Llc | $80,000 | None Available | |
| Heritage Assets Llc | -- | None Available | |
| Wheelock Paul A | $166,000 | None Available |
Source: Public Records
Mortgage History
| Date | Status | Borrower | Loan Amount |
|---|---|---|---|
| Open | K-Kids Llc | $60,000 | |
| Previous Owner | Wheelock Paul A | $141,100 |
Source: Public Records
Tax History
| Year | Tax Paid | Tax Assessment Tax Assessment Total Assessment is a certain percentage of the fair market value that is determined by local assessors to be the total taxable value of land and additions on the property. | Land | Improvement |
|---|---|---|---|---|
| 2025 | $3,773 | $301,500 | $26,100 | $275,400 |
| 2024 | $3,773 | $246,800 | $20,900 | $225,900 |
| 2023 | $3,675 | $246,800 | $20,900 | $225,900 |
| 2022 | $3,639 | $204,060 | $20,880 | $183,180 |
| 2021 | $3,639 | $204,060 | $20,880 | $183,180 |
| 2020 | $4,051 | $204,060 | $20,880 | $183,180 |
| 2019 | $1,915 | $204,060 | $20,880 | $183,180 |
| 2018 | $2,311 | $108,816 | $18,778 | $90,038 |
| 2017 | $2,459 | $108,816 | $18,778 | $90,038 |
| 2016 | $2,299 | $108,816 | $18,778 | $90,038 |
| 2015 | -- | $101,406 | $18,799 | $82,607 |
| 2014 | $1,728 | $93,860 | $17,400 | $76,460 |
Source: Public Records
Map
Nearby Homes
- 2250 Washington St
- 2318 Washington St
- 811 Rhomberg Ave
- 2243 White St
- 2417 Jackson St
- 2418 White St
- 2340 Central Ave
- 2034 Jackson St
- 922 Lincoln Ave
- 2527 Washington St
- 1902 White St
- 271 Valeria St
- 2575 Jackson St
- 2071 N Main St
- 340 Valeria St
- 2578 Central Ave
- 316 Kaufmann Ave
- 2605 White St
- 1223 Lincoln Ave
- 1735 Central Ave
Your Personal Tour Guide
Ask me questions while you tour the home.