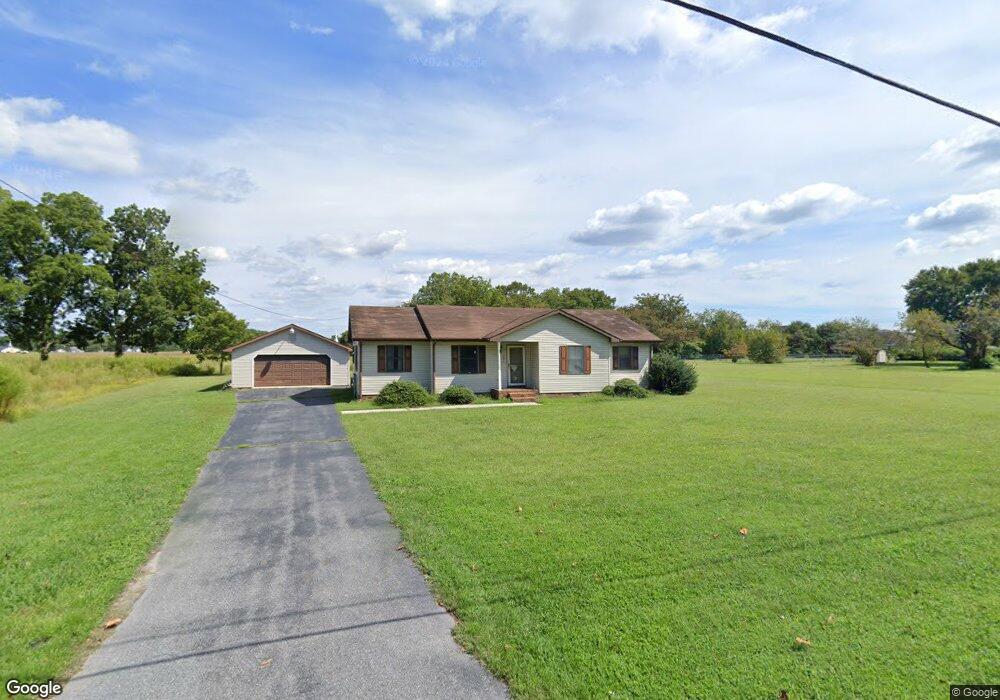
609 E Main St Fruitland, MD 21826
Estimated Value: $284,947 - $321,000
Studio
2
Baths
1,486
Sq Ft
$204/Sq Ft
Est. Value
About This Home
This home is located at 609 E Main St, Fruitland, MD 21826 and is currently estimated at $303,737, approximately $204 per square foot. 609 E Main St is a home located in Wicomico County with nearby schools including Fruitland Primary School, Fruitland Intermediate School, and Bennett Middle School.
Ownership History
Date
Name
Owned For
Owner Type
Purchase Details
Closed on
Jul 22, 2016
Sold by
M & G Rental Properties Llc
Bought by
Rogers Kelly A
Current Estimated Value
Home Financials for this Owner
Home Financials are based on the most recent Mortgage that was taken out on this home.
Original Mortgage
$110,500
Outstanding Balance
$88,155
Interest Rate
3.56%
Mortgage Type
New Conventional
Estimated Equity
$215,582
Purchase Details
Closed on
Aug 12, 2011
Sold by
Stainbrook Nadine Marie
Bought by
Avelon Inn Llc
Purchase Details
Closed on
Nov 10, 2008
Sold by
Payne Milton L and Payne E
Bought by
Stainbrook Nadine M
Purchase Details
Closed on
Aug 1, 2008
Sold by
Payne Milton L and Payne E
Bought by
Stainbrook Nadine M
Purchase Details
Closed on
Mar 19, 2007
Sold by
Payne Milton
Bought by
Payne Milton and Stainbrook Nadine M
Purchase Details
Closed on
Mar 15, 2007
Sold by
Payne Milton
Bought by
Payne Milton and Stainbrook Nadine M
Create a Home Valuation Report for This Property
The Home Valuation Report is an in-depth analysis detailing your home's value as well as a comparison with similar homes in the area
Home Values in the Area
Average Home Value in this Area
Purchase History
| Date | Buyer | Sale Price | Title Company |
|---|---|---|---|
| Rogers Kelly A | $140,000 | Attorney | |
| Avelon Inn Llc | $121,000 | None Available | |
| Stainbrook Nadine M | -- | -- | |
| Stainbrook Nadine M | -- | -- | |
| Payne Milton | -- | -- | |
| Payne Milton | -- | -- |
Source: Public Records
Mortgage History
| Date | Status | Borrower | Loan Amount |
|---|---|---|---|
| Open | Rogers Kelly A | $110,500 |
Source: Public Records
Tax History
| Year | Tax Paid | Tax Assessment Tax Assessment Total Assessment is a certain percentage of the fair market value that is determined by local assessors to be the total taxable value of land and additions on the property. | Land | Improvement |
|---|---|---|---|---|
| 2025 | $1,882 | $206,000 | $0 | $0 |
| 2024 | $1,795 | $187,200 | $34,900 | $152,300 |
| 2023 | $1,757 | $177,767 | $0 | $0 |
| 2022 | $1,715 | $168,333 | $0 | $0 |
| 2021 | $1,639 | $158,900 | $34,900 | $124,000 |
| 2020 | $1,639 | $158,900 | $34,900 | $124,000 |
| 2019 | $1,663 | $158,900 | $34,900 | $124,000 |
| 2018 | $1,721 | $163,600 | $34,900 | $128,700 |
| 2017 | $1,582 | $150,367 | $0 | $0 |
| 2016 | -- | $137,133 | $0 | $0 |
| 2015 | $1,419 | $123,900 | $0 | $0 |
| 2014 | $1,419 | $123,900 | $0 | $0 |
Source: Public Records
Map
Nearby Homes
- 633 E Main St
- 116 Nina Ln
- 126 Paddock Dr
- 3960 Saint Lukes Rd
- 225 Moonglow Rd
- 159 Nina Ln
- 424 Lena Ln
- 505 Saint Lukes Rd
- 405 Lena Ln
- 213 N Brown St
- 215 N Brown St
- 221 N Brown St
- 223 N Brown St
- 210 Ringgold Rd
- 227 N Brown St
- 158 Porter Pkwy
- 210 Green St
- 306 Elizabeth St
- 220 Sand Castle Blvd
- 304 Elizabeth St
Your Personal Tour Guide
Ask me questions while you tour the home.