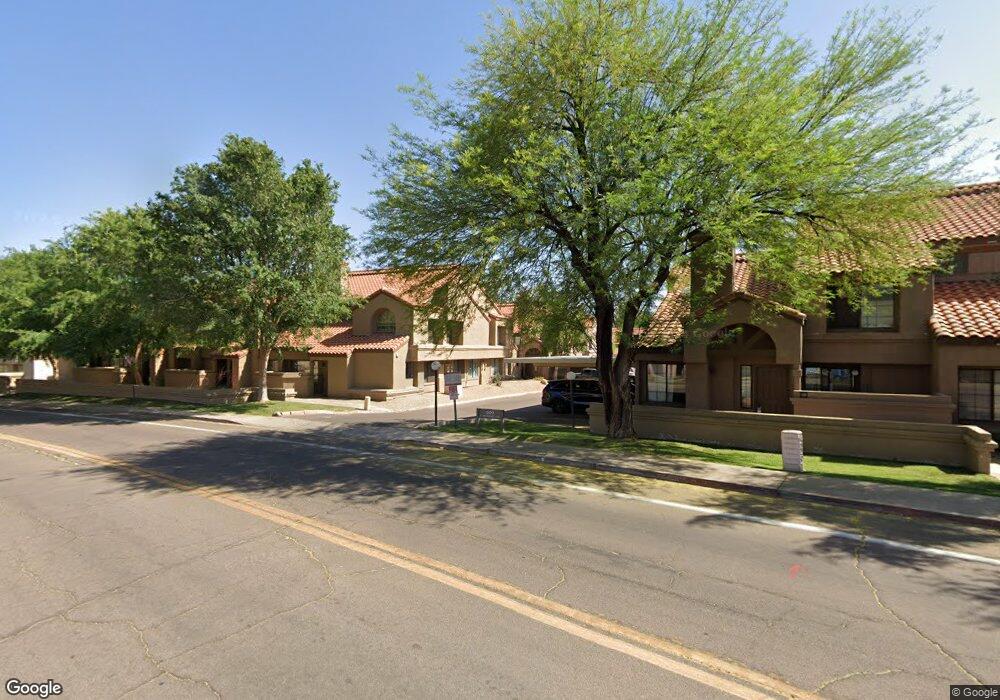
609 E Mesquite Cir Unit D101 Tempe, AZ 85281
North Tempe NeighborhoodEstimated Value: $330,000 - $393,000
3
Beds
3
Baths
1,536
Sq Ft
$242/Sq Ft
Est. Value
About This Home
This home is located at 609 E Mesquite Cir Unit D101, Tempe, AZ 85281 and is currently estimated at $371,564, approximately $241 per square foot. 609 E Mesquite Cir Unit D101 is a home located in Maricopa County with nearby schools including Laird Elementary School, McClintock High School, and South Pointe Elementary School.
Ownership History
Date
Name
Owned For
Owner Type
Purchase Details
Closed on
Apr 5, 2019
Sold by
David J P and David Julie D
Bought by
Rlt Joseph and Rlt Julie
Current Estimated Value
Purchase Details
Closed on
Aug 1, 1997
Sold by
David Julie D
Bought by
David Joseph Parker
Home Financials for this Owner
Home Financials are based on the most recent Mortgage that was taken out on this home.
Original Mortgage
$88,000
Interest Rate
7.58%
Mortgage Type
New Conventional
Purchase Details
Closed on
Jul 28, 1997
Sold by
Dulin Lynn and Dulin Charles Daniel
Bought by
Parker David Jr J P and Parker David Jr Joseph
Home Financials for this Owner
Home Financials are based on the most recent Mortgage that was taken out on this home.
Original Mortgage
$88,000
Interest Rate
7.58%
Mortgage Type
New Conventional
Create a Home Valuation Report for This Property
The Home Valuation Report is an in-depth analysis detailing your home's value as well as a comparison with similar homes in the area
Home Values in the Area
Average Home Value in this Area
Purchase History
| Date | Buyer | Sale Price | Title Company |
|---|---|---|---|
| Rlt Joseph | -- | None Available | |
| David Joseph Parker | -- | Lawyers Title Of Arizona Inc | |
| Parker David Jr J P | $110,000 | Lawyers Title Of Arizona Inc |
Source: Public Records
Mortgage History
| Date | Status | Borrower | Loan Amount |
|---|---|---|---|
| Previous Owner | Parker David Jr J P | $88,000 |
Source: Public Records
Tax History Compared to Growth
Tax History
| Year | Tax Paid | Tax Assessment Tax Assessment Total Assessment is a certain percentage of the fair market value that is determined by local assessors to be the total taxable value of land and additions on the property. | Land | Improvement |
|---|---|---|---|---|
| 2025 | $1,894 | $15,804 | -- | -- |
| 2024 | $1,749 | $15,051 | -- | -- |
| 2023 | $1,749 | $25,080 | $5,010 | $20,070 |
| 2022 | $1,678 | $20,530 | $4,100 | $16,430 |
| 2021 | $1,689 | $20,420 | $4,080 | $16,340 |
| 2020 | $1,638 | $18,510 | $3,700 | $14,810 |
| 2019 | $1,607 | $18,060 | $3,610 | $14,450 |
| 2018 | $1,567 | $16,760 | $3,350 | $13,410 |
| 2017 | $1,520 | $15,370 | $3,070 | $12,300 |
| 2016 | $1,510 | $15,460 | $3,090 | $12,370 |
| 2015 | $1,450 | $14,060 | $2,810 | $11,250 |
Source: Public Records
Map
Nearby Homes
- 609 E Mesquite Cir Unit D 131
- 609 E Mesquite Cir Unit D133
- 700 E Mesquite Cir Unit O210
- 700 E Mesquite Cir Unit O109
- 925 N College Ave Unit C110
- 925 E Henry St
- 954 E Henry St
- 1004 E Tempe Dr
- 1425 N Gene Ave
- 1016 E Tempe Dr
- 1421 N Mcallister Ave
- 945 E Playa Del Norte Dr Unit 5022
- 945 E Playa Del Norte Dr Unit 1003
- 945 E Playa Del Norte Dr Unit 3009
- 945 E Playa Del Norte Dr Unit 5023
- 945 E Playa Del Norte Dr Unit 4020
- 945 E Playa Del Norte Dr Unit 3003
- 1030 E Weber Dr
- 401 E Barbara Dr
- 1252 E Curry Rd
- 609 E Mesquite Cir Unit C120
- 609 E Mesquite Cir
- 609 E Mesquite Cir Unit A110
- 609 E Mesquite Cir Unit a116
- 609 E Mesquite Cir Unit 128
- 609 E Mesquite Cir Unit D131 131D
- 609 E Mesquite Cir Unit B106
- 609 E Mesquite Cir Unit B103
- 609 E Mesquite Cir Unit B101
- 609 E Mesquite Cir Unit B105
- 609 E Mesquite Cir Unit B108
- 609 E Mesquite Cir Unit B106
- 609 E Mesquite Cir Unit D52
- 609 E Mesquite Cir Unit B104
- 609 E Mesquite Cir Unit E123
- 609 E Mesquite Cir Unit D130
- 609 E Mesquite Cir Unit B102
- 609 E Mesquite Cir Unit B105
- 609 E Mesquite Cir Unit B107
- 609 E Mesquite Cir Unit B103