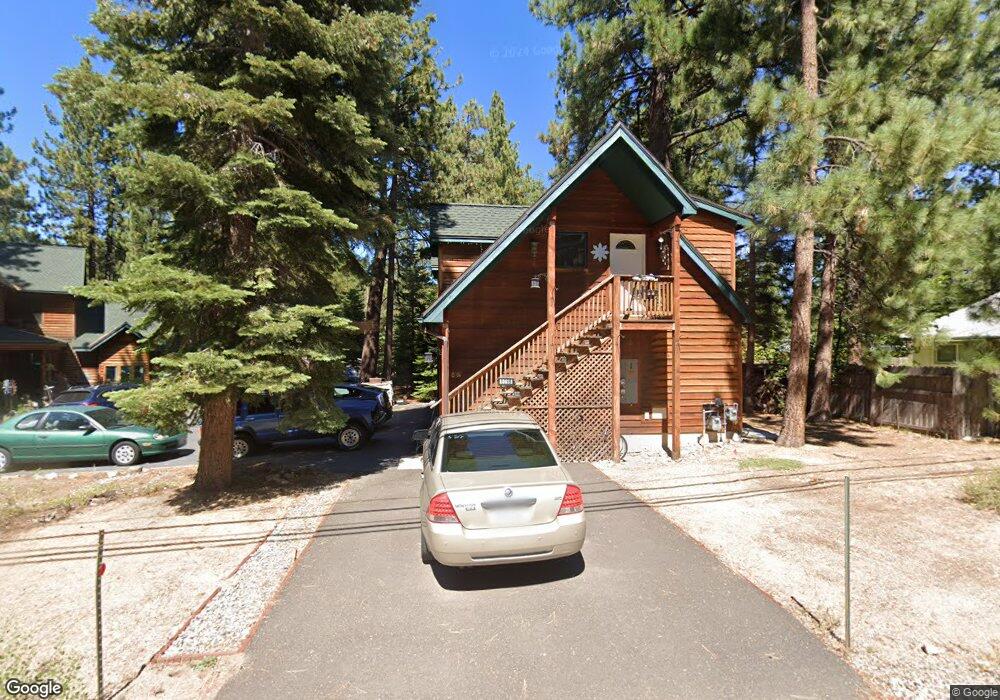
609 Eloise Ave South Lake Tahoe, CA 96150
Estimated Value: $1,336,000 - $2,164,000
8
Beds
8
Baths
3,443
Sq Ft
$471/Sq Ft
Est. Value
About This Home
This home is located at 609 Eloise Ave, South Lake Tahoe, CA 96150 and is currently estimated at $1,621,333, approximately $470 per square foot. 609 Eloise Ave is a home located in El Dorado County with nearby schools including Tahoe Valley Elementary School, South Tahoe Middle School, and South Tahoe High School.
Ownership History
Date
Name
Owned For
Owner Type
Purchase Details
Closed on
Sep 23, 2015
Sold by
Covey Steven D and Covey Linda R
Bought by
The Covey Family Trust
Current Estimated Value
Purchase Details
Closed on
Nov 17, 1998
Sold by
Brackett Chritian D and Brackett Jennifer
Bought by
Covey Steven D and Covey Linda R
Purchase Details
Closed on
Jan 13, 1997
Sold by
Herrmann Ralph and Herrmann Teffaite S
Bought by
Brackett Christian D and Brackett Jennifer
Home Financials for this Owner
Home Financials are based on the most recent Mortgage that was taken out on this home.
Original Mortgage
$30,000
Interest Rate
7.46%
Purchase Details
Closed on
Oct 22, 1996
Sold by
Hoffman and Shirley
Bought by
Herrmann Ralph and Herrmann Tefaite S
Home Financials for this Owner
Home Financials are based on the most recent Mortgage that was taken out on this home.
Original Mortgage
$23,349
Interest Rate
8.14%
Create a Home Valuation Report for This Property
The Home Valuation Report is an in-depth analysis detailing your home's value as well as a comparison with similar homes in the area
Home Values in the Area
Average Home Value in this Area
Purchase History
| Date | Buyer | Sale Price | Title Company |
|---|---|---|---|
| The Covey Family Trust | -- | None Available | |
| Covey Steven D | $115,000 | Placer Title Company | |
| Brackett Christian D | $30,000 | Placer Title Company | |
| Herrmann Ralph | $24,000 | Placer Title Company | |
| Hoffman Kenneth | -- | Placer Title Company | |
| Hoffman Kenneth Wayne | -- | Placer Title Company |
Source: Public Records
Mortgage History
| Date | Status | Borrower | Loan Amount |
|---|---|---|---|
| Previous Owner | Brackett Christian D | $30,000 | |
| Previous Owner | Herrmann Ralph | $23,349 |
Source: Public Records
Tax History Compared to Growth
Tax History
| Year | Tax Paid | Tax Assessment Tax Assessment Total Assessment is a certain percentage of the fair market value that is determined by local assessors to be the total taxable value of land and additions on the property. | Land | Improvement |
|---|---|---|---|---|
| 2025 | $13,472 | $1,296,372 | $180,272 | $1,116,100 |
| 2024 | $13,472 | $1,270,954 | $176,738 | $1,094,216 |
| 2023 | $13,229 | $1,246,034 | $173,273 | $1,072,761 |
| 2022 | $13,103 | $1,221,603 | $169,876 | $1,051,727 |
| 2021 | $12,897 | $1,197,651 | $166,546 | $1,031,105 |
| 2020 | $12,709 | $1,185,372 | $164,839 | $1,020,533 |
| 2019 | $12,645 | $1,162,130 | $161,607 | $1,000,523 |
| 2018 | $12,360 | $1,139,344 | $158,439 | $980,905 |
| 2017 | $8,608 | $790,000 | $146,000 | $644,000 |
| 2016 | $8,599 | $790,000 | $146,000 | $644,000 |
| 2015 | $8,635 | $790,000 | $146,000 | $644,000 |
| 2014 | $7,400 | $692,000 | $125,000 | $567,000 |
Source: Public Records
Map
Nearby Homes
- 629 James Ave
- 2028 13th St
- 673 James Ave
- 516 Emerald Bay Rd Unit 426
- 516 Emerald Bay Rd Unit 49
- 724 Tahoe Island Dr
- 776 Patricia Ln
- 2031 Venice Dr Unit 322
- 552 Christie Dr Unit 307
- 1938 Marconi Way
- 760 Clement St
- 2175 Royal Ave
- 2191 Butler Ave
- 2081 Venice Dr Unit 285
- 2081 Venice Dr Unit 280
- 603 Gardner St
- 807 Clement St
- 581 Alpine Dr
- 487 Christie Dr
- 569 Lucerne Way
- 621 Eloise Ave
- 575 Eloise Ave
- 618 Eloise Ave Unit B
- 2057 13th St
- 629 Eloise Ave
- 590 Eloise Ave
- 2033 13th St
- 621 James Ave
- 2040 13th St
- 567 Eloise Ave
- 629 James Ave Unit 13
- 641 Eloise Ave
- 2054 13th St Unit Cabin 3
- 2054 13th St
- 2036 13th St
- 578 Eloise Ave
- 561 Eloise Ave
- 602 Anita Dr
- 579 James Ave Unit 2
- 579 James Ave Unit 4