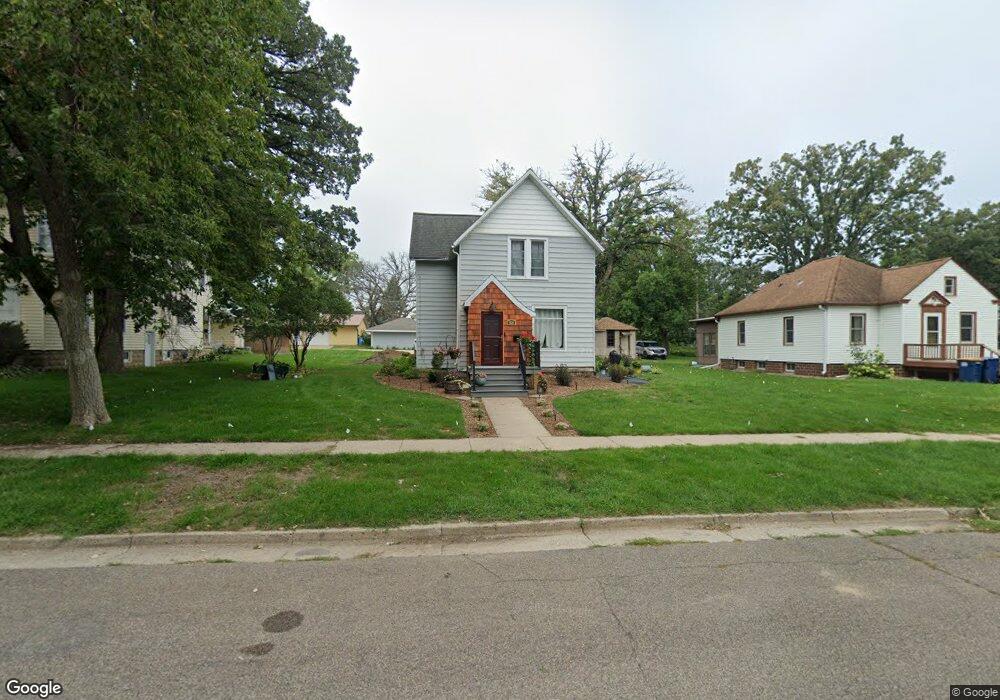
609 Front St Kenyon, MN 55946
Estimated Value: $195,000 - $217,000
2
Beds
2
Baths
1,353
Sq Ft
$151/Sq Ft
Est. Value
About This Home
This home is located at 609 Front St, Kenyon, MN 55946 and is currently estimated at $204,381, approximately $151 per square foot. 609 Front St is a home located in Goodhue County with nearby schools including Kenyon-Wanamingo Elementary School, Kenyon-Wanamingo Middle School, and Kenyon-Wanamingo Senior High School.
Ownership History
Date
Name
Owned For
Owner Type
Purchase Details
Closed on
Apr 6, 2012
Sold by
Laue Darvin D and Laue Anne M
Bought by
Johnson Daniel L and Johnson Erica A
Current Estimated Value
Purchase Details
Closed on
May 7, 2010
Sold by
Lave Anne and Lave Darvin D
Bought by
Johnson Daniel A and Johnson Erica A
Home Financials for this Owner
Home Financials are based on the most recent Mortgage that was taken out on this home.
Original Mortgage
$101,500
Interest Rate
6.5%
Mortgage Type
Land Contract Argmt. Of Sale
Purchase Details
Closed on
Feb 16, 2010
Sold by
Secretary Of Housing & Urban Development
Bought by
Laue Anne and Laue Darvin
Purchase Details
Closed on
Sep 24, 2004
Sold by
Mills Angela R and Mills Greg B
Bought by
Finstad Annelle S and Finstad Kevin
Purchase Details
Closed on
Jun 6, 2002
Sold by
Ronning Donna M and Lehman James R
Bought by
Mills Greg B and Brezina Angela
Create a Home Valuation Report for This Property
The Home Valuation Report is an in-depth analysis detailing your home's value as well as a comparison with similar homes in the area
Purchase History
| Date | Buyer | Sale Price | Title Company |
|---|---|---|---|
| Johnson Daniel L | $102,000 | -- | |
| Johnson Daniel A | $102,000 | -- | |
| Laue Anne | $31,000 | -- | |
| Finstad Annelle S | $126,500 | -- | |
| Mills Greg B | $39,868 | -- | |
| Mills Greg B | $48,031 | -- |
Source: Public Records
Mortgage History
| Date | Status | Borrower | Loan Amount |
|---|---|---|---|
| Previous Owner | Johnson Daniel A | $101,500 |
Source: Public Records
Tax History
| Year | Tax Paid | Tax Assessment Tax Assessment Total Assessment is a certain percentage of the fair market value that is determined by local assessors to be the total taxable value of land and additions on the property. | Land | Improvement |
|---|---|---|---|---|
| 2025 | $2,108 | $170,300 | $39,100 | $131,200 |
| 2024 | $2,108 | $166,500 | $39,100 | $127,400 |
| 2023 | $1,038 | $155,700 | $39,100 | $116,600 |
| 2022 | $1,812 | $153,600 | $39,100 | $114,500 |
| 2021 | $1,618 | $123,200 | $35,700 | $87,500 |
| 2020 | $1,622 | $120,500 | $35,700 | $84,800 |
| 2019 | $1,248 | $121,100 | $35,700 | $85,400 |
| 2018 | $1,128 | $94,900 | $23,800 | $71,100 |
| 2017 | $1,032 | $89,700 | $23,800 | $65,900 |
| 2016 | $904 | $85,200 | $23,800 | $61,400 |
| 2015 | $890 | $78,000 | $23,800 | $54,200 |
| 2014 | -- | $74,600 | $20,400 | $54,200 |
Source: Public Records
Map
Nearby Homes
- 103 Bullis St
- 412 3rd St
- 413 Fawn Run
- 411 Bullis St
- 416 Buckshot Ct
- 207 Whitetail Ln
- 206 Whitetail Ln
- 213 6th St
- 705 State St
- 450 Engel Dr
- 550 Engel Dr
- -XXX 20th Ave
- 451 Engel Dr
- 47155 Monkey Valley Hollow
- 44241 70th Ave
- 420 Kielmeyer Ave NE
- 10055 460th St
- 124 Ellington St
- 300 Arnold St
- TBD Minnesota 57
Your Personal Tour Guide
Ask me questions while you tour the home.