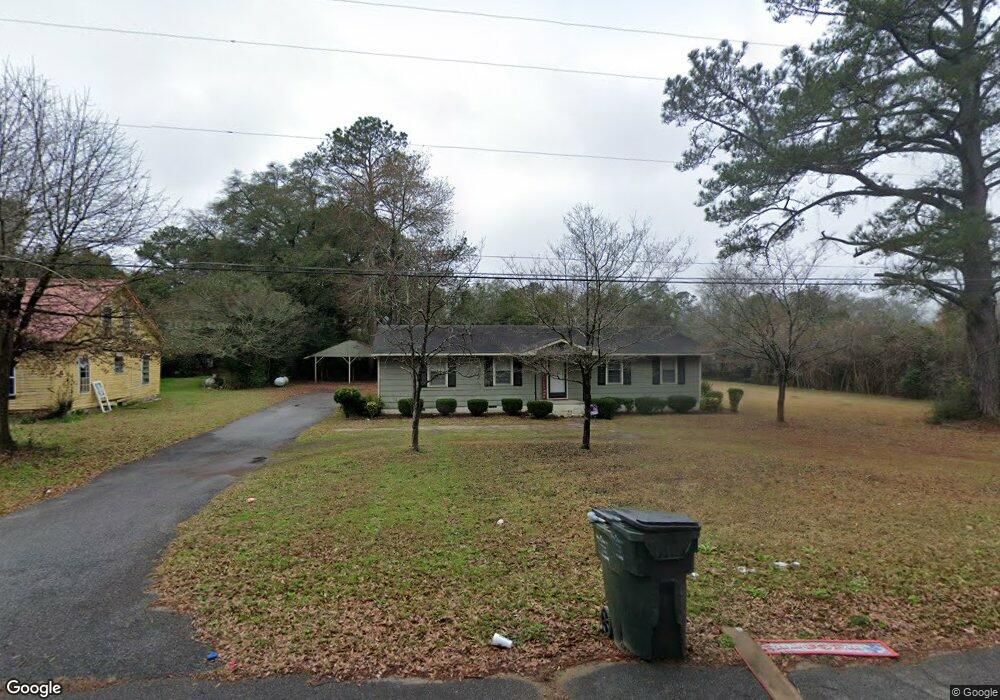
609 Keen Ave Oglethorpe, GA 31068
Estimated Value: $72,000 - $143,057
3
Beds
2
Baths
1,232
Sq Ft
$88/Sq Ft
Est. Value
About This Home
This home is located at 609 Keen Ave, Oglethorpe, GA 31068 and is currently estimated at $108,014, approximately $87 per square foot. 609 Keen Ave is a home with nearby schools including Macon County Elementary School, Macon County Middle School, and Macon County High School.
Ownership History
Date
Name
Owned For
Owner Type
Purchase Details
Closed on
Jun 20, 2011
Sold by
Jones Mistie C and Jones Melvin
Bought by
Jones Mistie C and Jones Marcus D
Current Estimated Value
Home Financials for this Owner
Home Financials are based on the most recent Mortgage that was taken out on this home.
Original Mortgage
$66,104
Outstanding Balance
$46,587
Interest Rate
5.5%
Mortgage Type
FHA
Estimated Equity
$61,427
Purchase Details
Closed on
Oct 1, 1998
Sold by
Melvin Mistie C
Bought by
Melvin Mistie C
Purchase Details
Closed on
Jun 16, 1998
Sold by
Jones Rodney D
Bought by
Melvin Mistie C
Purchase Details
Closed on
Apr 27, 1987
Sold by
During Donald L and During D
Bought by
Massey Linda F
Purchase Details
Closed on
Aug 24, 1979
Sold by
Lamberth John W and Lamberth S
Bought by
During Donald L and During D
Purchase Details
Closed on
Jan 1, 1965
Bought by
Lamberth John W and Lamberth S
Create a Home Valuation Report for This Property
The Home Valuation Report is an in-depth analysis detailing your home's value as well as a comparison with similar homes in the area
Purchase History
| Date | Buyer | Sale Price | Title Company |
|---|---|---|---|
| Jones Mistie C | -- | -- | |
| Melvin Mistie C | -- | -- | |
| Melvin Mistie C | $61,000 | -- | |
| Massey Linda F | $24,900 | -- | |
| During Donald L | $27,000 | -- | |
| Lamberth John W | -- | -- |
Source: Public Records
Mortgage History
| Date | Status | Borrower | Loan Amount |
|---|---|---|---|
| Open | Jones Mistie C | $66,104 |
Source: Public Records
Tax History
| Year | Tax Paid | Tax Assessment Tax Assessment Total Assessment is a certain percentage of the fair market value that is determined by local assessors to be the total taxable value of land and additions on the property. | Land | Improvement |
|---|---|---|---|---|
| 2024 | $1,525 | $34,456 | $1,600 | $32,856 |
| 2023 | $1,525 | $34,456 | $1,600 | $32,856 |
| 2022 | $798 | $27,446 | $1,600 | $25,846 |
| 2021 | $857 | $19,914 | $1,600 | $18,314 |
| 2020 | $607 | $19,914 | $1,600 | $18,314 |
| 2019 | $875 | $20,327 | $1,600 | $18,727 |
| 2018 | $559 | $20,327 | $1,600 | $18,727 |
| 2017 | $559 | $20,327 | $1,600 | $18,727 |
| 2016 | $562 | $20,327 | $1,600 | $18,727 |
| 2015 | -- | $23,210 | $1,600 | $21,611 |
| 2014 | -- | $23,211 | $1,600 | $21,611 |
| 2013 | -- | $23,210 | $1,600 | $21,610 |
Source: Public Records
Map
Nearby Homes
- 204 Jordan St
- 310 Sumter St
- 311 Macon St
- 562 W Anderson St
- 432 Clifton Bradley Dr
- 503 S Dooly St
- 204 N Dooly St
- 326 N Dooly St
- 110 E Artesian Ave
- 100 Minor Ave
- 511 Forsyth St
- 311 Overlook Dr
- 505 Engram St
- 202 Minor Ave
- 601 Engram St
- 102 June Dr
- 514 Patricia Dr
- 504 Patricia Dr
- 510 Patricia Dr
- 203 Combs Dr
Your Personal Tour Guide
Ask me questions while you tour the home.